AUD/USD hovers around 0.6480 as US Dollar trims earlier gains, ahead of US NFP
- AUD/USD trades flat after falling to a daily low of 0.6461.
- US PCE inflation meets expectations at 3.3% YoY, while Initial Jobless Claims come below estimates, providing a brief boost to the Greenback.
- China’s mixed PMI data and Atlanta’s Fed President Raphael Bostic’s comments complicate the currency pair’s outlook.

The Australian Dollar (AUD) trims some of its losses against the US Dollar (USD) after falling to a daily low of 0.6461 ahead of the London fix, while the Greenback gives back some of its earlier gains. Traders booking profits ahead of market-moving data from the United States (US) is the main reason behind the recent US Dollar weakness. The AUD/USD is trading at 0.6474, flat in the day.
Aussie Dollar stages a comeback from daily lows, as traders book profits before August’s NFP
The financial markets remain quiet so far, past the mid-New York session. The economic agenda in the US spurred some volatility in the early trading session, courtesy of the latest inflation report. The Fed’s preferred gauge for inflation, the Personal Consumption Expenditure (PCE), was 3.3% YoY, as expected above June’s 3%. Regarding core PCE, sought by Fed officials, as its focal point is stickier than what policymakers were projecting, it stands at 4.s% YoY as foreseen but above the previous month’s 4.1%.
That data and the latest unemployment claims for the week ending August 26, coming below estimates of 235K, at 229K, sponsored a leg-up in the US Dollar. Initial Jobless Claims were the first positive news in the labor market during the week, as job openings plummeted, while private hiring disappointed analysts.
In the meantime, the US Dollar Index, which measures the buck’s value against a basket of six currencies, rises by 0.41%, at 103.606. US Treasury bond yields dropped
An upbeat market sentiment cushioned the AUD/USD as China revealed that Manufacturing PMIs improved but remained in contractionary territory. The non-manufacturing PMI deteriorateds from 51.5 to 51.0, below estimates of 51.1.
On the central bank front, Atlanta’s Fed President Raphael Bostic said the policy was appropriately restrictive to bring inflation towards the US central bank’s 2% target over a “reasonable” period.
In the week ahead, the Australian economic docket will feature S&P Global Manufacturing PMI for August. On the US front, the economic agenda is set to be busy, highlighted by the release of Nonfarm Payrolls and the ISM Manufacturing PMI, both of which are figures for August.
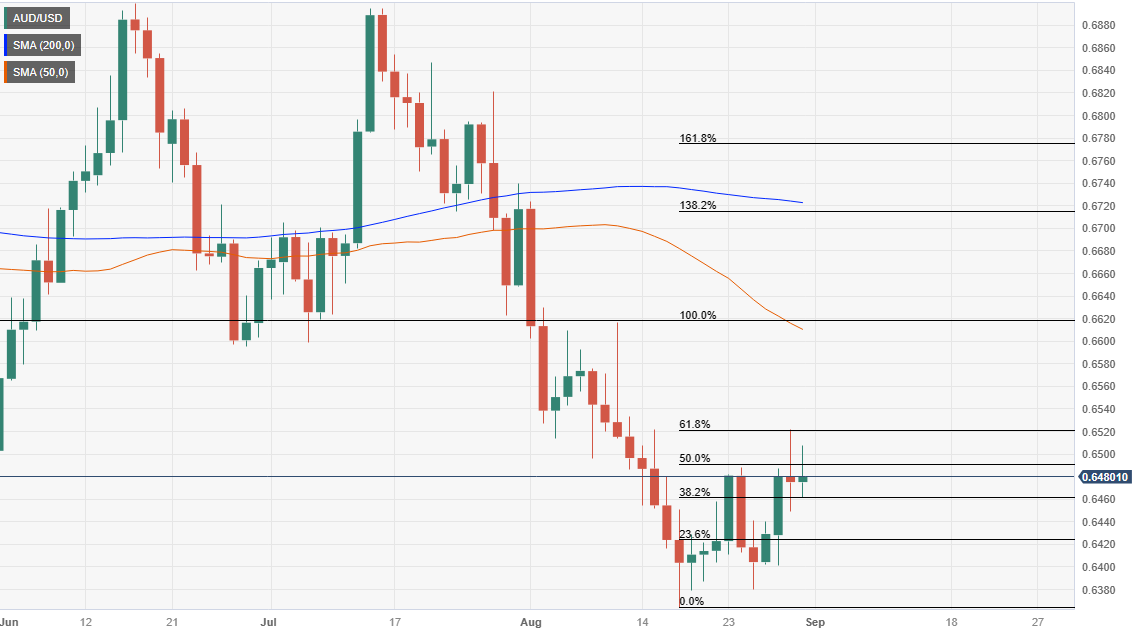
AUD/USD Price Analysis: Technical outlook
From a technical standpoint, the AUD/USD remains neutral to downward bias, as it remains below the 50 and 200-day Moving Averages (DMAs). Nevertheless, recent price action suggests the current leg-up could be viewed as a correction that pierced the 61.8% Fibonacci (Fib) retracement at 0.6520. That, alongside back-to-back spinning tops candlesticks, could pave the way for further losses, with traders eyeing the year-to-date (YTD) low of 0.6364
Author

Christian Borjon Valencia
FXStreet
Markets analyst, news editor, and trading instructor with over 14 years of experience across FX, commodities, US equity indices, and global macro markets.


