AUD/USD holds gains as RBA, Fed expectations drive price action
- Australian inflation expectations rise, increasing the likelihood that the RBA may hold back on additional rate cuts.
- Inflation trends in the United States ease, raising projections of a Fed rate cut in September.
- The AUD/USD rises as forecasts of a narrowing monetary policy divergence boost gains.

AUD/USD is trading just below key resistance as diverging economic signals between Australia and the United States drive renewed bullish momentum in the pair, which is currently trading at 0.6529, up 0.44% on Thursday.
Traders are closely monitoring Friday’s release of the University of Michigan Consumer Sentiment report and accompanying inflation expectations data.
The preliminary June Consumer Sentiment Index is expected to be 53.5, up from 52.2 in May. Meanwhile, inflation expectations over the 1-year and 5-year horizons were previously reported at 6.6% and 4.2%, respectively.
Any downside surprise in consumer sentiment or signs that inflation expectations remain elevated could heighten volatility in the USD and significantly influence the near-term direction of the AUD/USD exchange rate.
Inflation trends and interest rate expectations lift AUD/USD
Australia’s Consumer Inflation Expectations, reported on Thursday, surged to 5% in June, up from 4.1% in May. This increase has reignited speculation that the Reserve Bank of Australia (RBA) could pause any dovish pivot and maintain a hawkish policy stance in response to persistent inflation concerns.
In contrast, recent data from the United States has highlighted easing inflation trends and a stable labor market.
These developments have solidified expectations for Federal Reserve rate cuts, with markets now pricing in a cut for September.
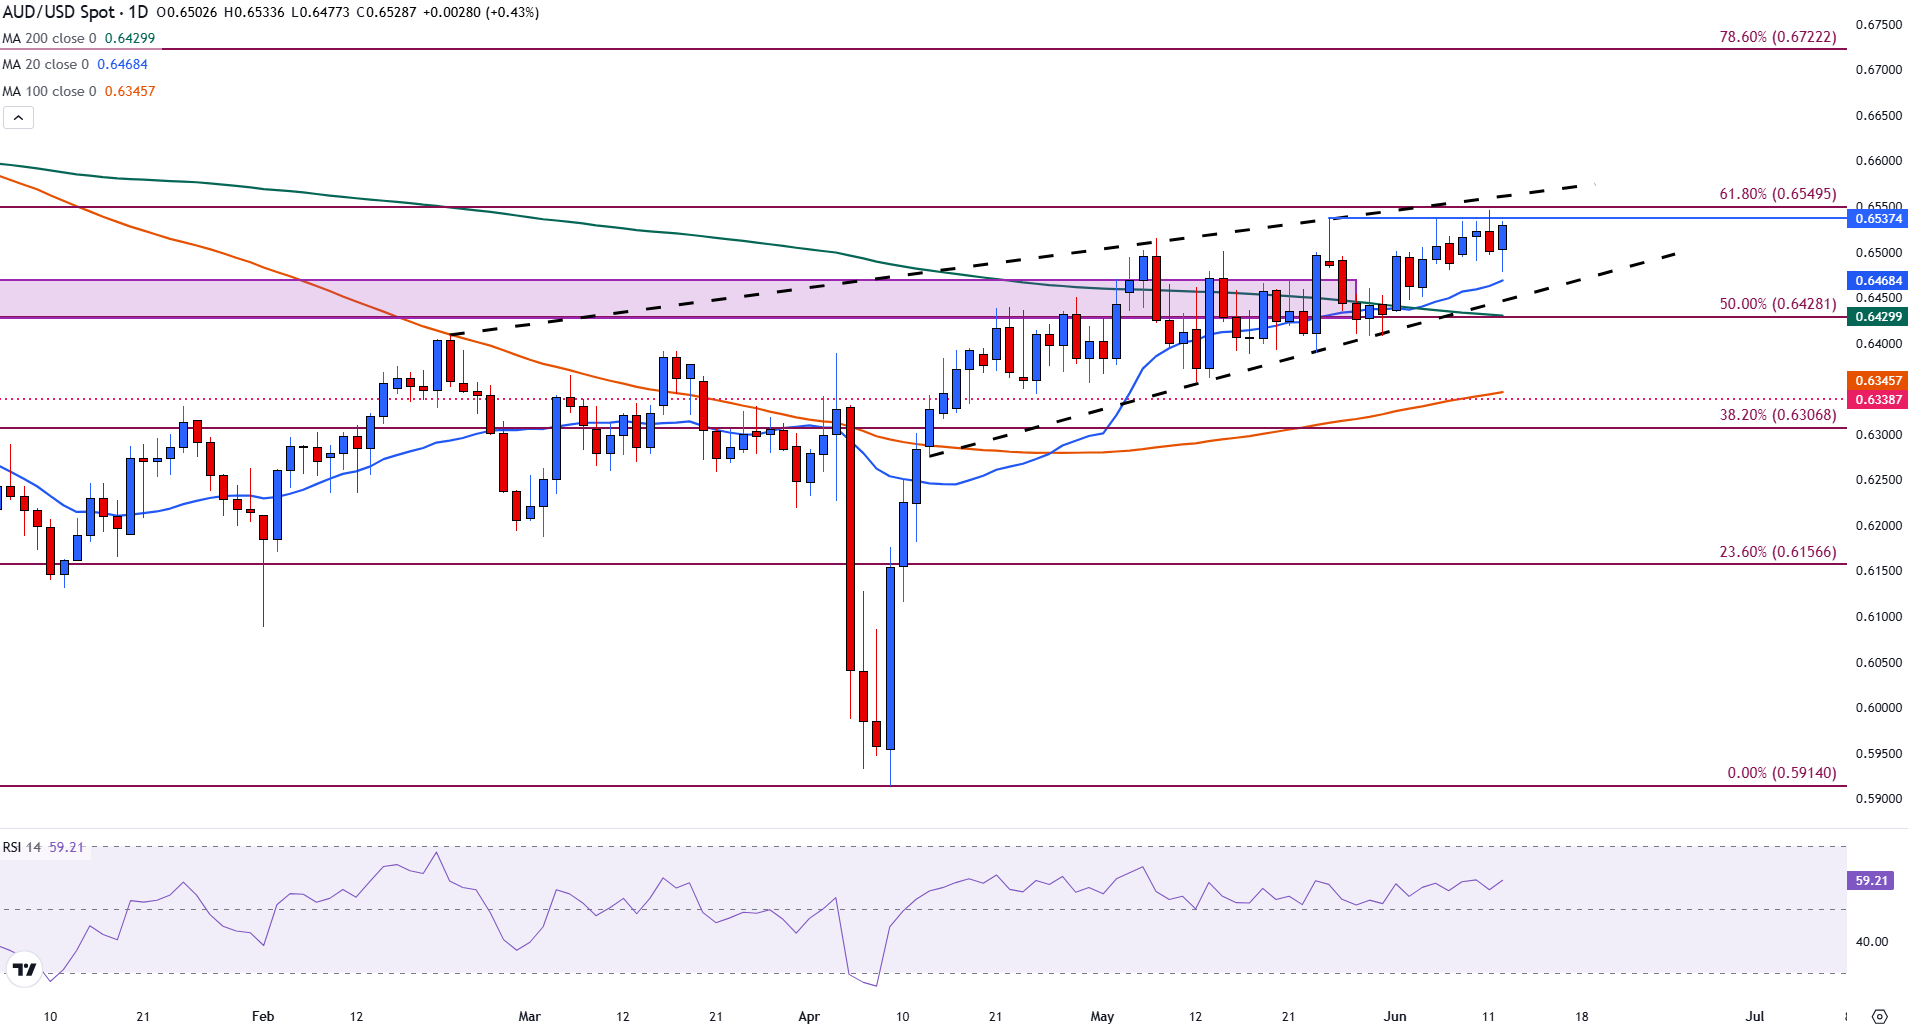
AUD/USD trades below wedge resistance while bullish momentum builds
AUD/USD is trading just below key resistance at 0.6537, which marks the upper boundary of the rising wedge pattern on May 26. Above that is 0.6545, which is currently the year-to-date high, reached on Wednesday.
A breakout above 0.6545 could open the door to further upside toward the 0.6600 psychological level, with the 78.6% retracement of the October-April decline at 0.6722 as a more extended target.
On the downside, immediate support is located at the 20-day Simple Moving Average (SMA), near 0.6468, followed by the 200-day SMA at 0.6428, which coincides with the 50% Fibonacci retracement and represents a key level to watch for a potential shift in momentum. The Relative Strength Index (RSI) at 59 suggests that bullish momentum is building but not yet overextended.
AUD/USD daily chart
Economic Indicator
Michigan Consumer Sentiment Index
The Michigan Consumer Sentiment Index, released on a monthly basis by the University of Michigan, is a survey gauging sentiment among consumers in the United States. The questions cover three broad areas: personal finances, business conditions and buying conditions. The data shows a picture of whether or not consumers are willing to spend money, a key factor as consumer spending is a major driver of the US economy. The University of Michigan survey has proven to be an accurate indicator of the future course of the US economy. The survey publishes a preliminary, mid-month reading and a final print at the end of the month. Generally, a high reading is bullish for the US Dollar (USD), while a low reading is bearish.
Read more.Next release: Fri Jun 13, 2025 14:00 (Prel)
Frequency: Monthly
Consensus: 53.5
Previous: 52.2
Source: University of Michigan
Consumer exuberance can translate into greater spending and faster economic growth, implying a stronger labor market and a potential pick-up in inflation, helping turn the Fed hawkish. This survey’s popularity among analysts (mentioned more frequently than CB Consumer Confidence) is justified because the data here includes interviews conducted up to a day or two before the official release, making it a timely measure of consumer mood, but foremost because it gauges consumer attitudes on financial and income situations. Actual figures beating consensus tend to be USD bullish.
Australian Dollar FAQs
One of the most significant factors for the Australian Dollar (AUD) is the level of interest rates set by the Reserve Bank of Australia (RBA). Because Australia is a resource-rich country another key driver is the price of its biggest export, Iron Ore. The health of the Chinese economy, its largest trading partner, is a factor, as well as inflation in Australia, its growth rate and Trade Balance. Market sentiment – whether investors are taking on more risky assets (risk-on) or seeking safe-havens (risk-off) – is also a factor, with risk-on positive for AUD.
The Reserve Bank of Australia (RBA) influences the Australian Dollar (AUD) by setting the level of interest rates that Australian banks can lend to each other. This influences the level of interest rates in the economy as a whole. The main goal of the RBA is to maintain a stable inflation rate of 2-3% by adjusting interest rates up or down. Relatively high interest rates compared to other major central banks support the AUD, and the opposite for relatively low. The RBA can also use quantitative easing and tightening to influence credit conditions, with the former AUD-negative and the latter AUD-positive.
China is Australia’s largest trading partner so the health of the Chinese economy is a major influence on the value of the Australian Dollar (AUD). When the Chinese economy is doing well it purchases more raw materials, goods and services from Australia, lifting demand for the AUD, and pushing up its value. The opposite is the case when the Chinese economy is not growing as fast as expected. Positive or negative surprises in Chinese growth data, therefore, often have a direct impact on the Australian Dollar and its pairs.
Iron Ore is Australia’s largest export, accounting for $118 billion a year according to data from 2021, with China as its primary destination. The price of Iron Ore, therefore, can be a driver of the Australian Dollar. Generally, if the price of Iron Ore rises, AUD also goes up, as aggregate demand for the currency increases. The opposite is the case if the price of Iron Ore falls. Higher Iron Ore prices also tend to result in a greater likelihood of a positive Trade Balance for Australia, which is also positive of the AUD.
The Trade Balance, which is the difference between what a country earns from its exports versus what it pays for its imports, is another factor that can influence the value of the Australian Dollar. If Australia produces highly sought after exports, then its currency will gain in value purely from the surplus demand created from foreign buyers seeking to purchase its exports versus what it spends to purchase imports. Therefore, a positive net Trade Balance strengthens the AUD, with the opposite effect if the Trade Balance is negative.
Author

Tammy Da Costa, CFTe®
FXStreet
Tammy is an economist and market analyst with a deep passion for financial markets, particularly commodities and geopolitics.


