|

AUD/NZD Price Prediction: Three Black Crows reversal pattern a bearish omen

  • AUD/NZD has confirmed a bearish reversal pattern after peaking in late November. 
  • The MACD has crossed below its signal line providing a sell signal.

AUD/NZD has completed a Three Black Crows candlestick pattern (red rectangle on chart) after peaking at the November 25 multi-month high.

AUD/NZD Daily Chart 

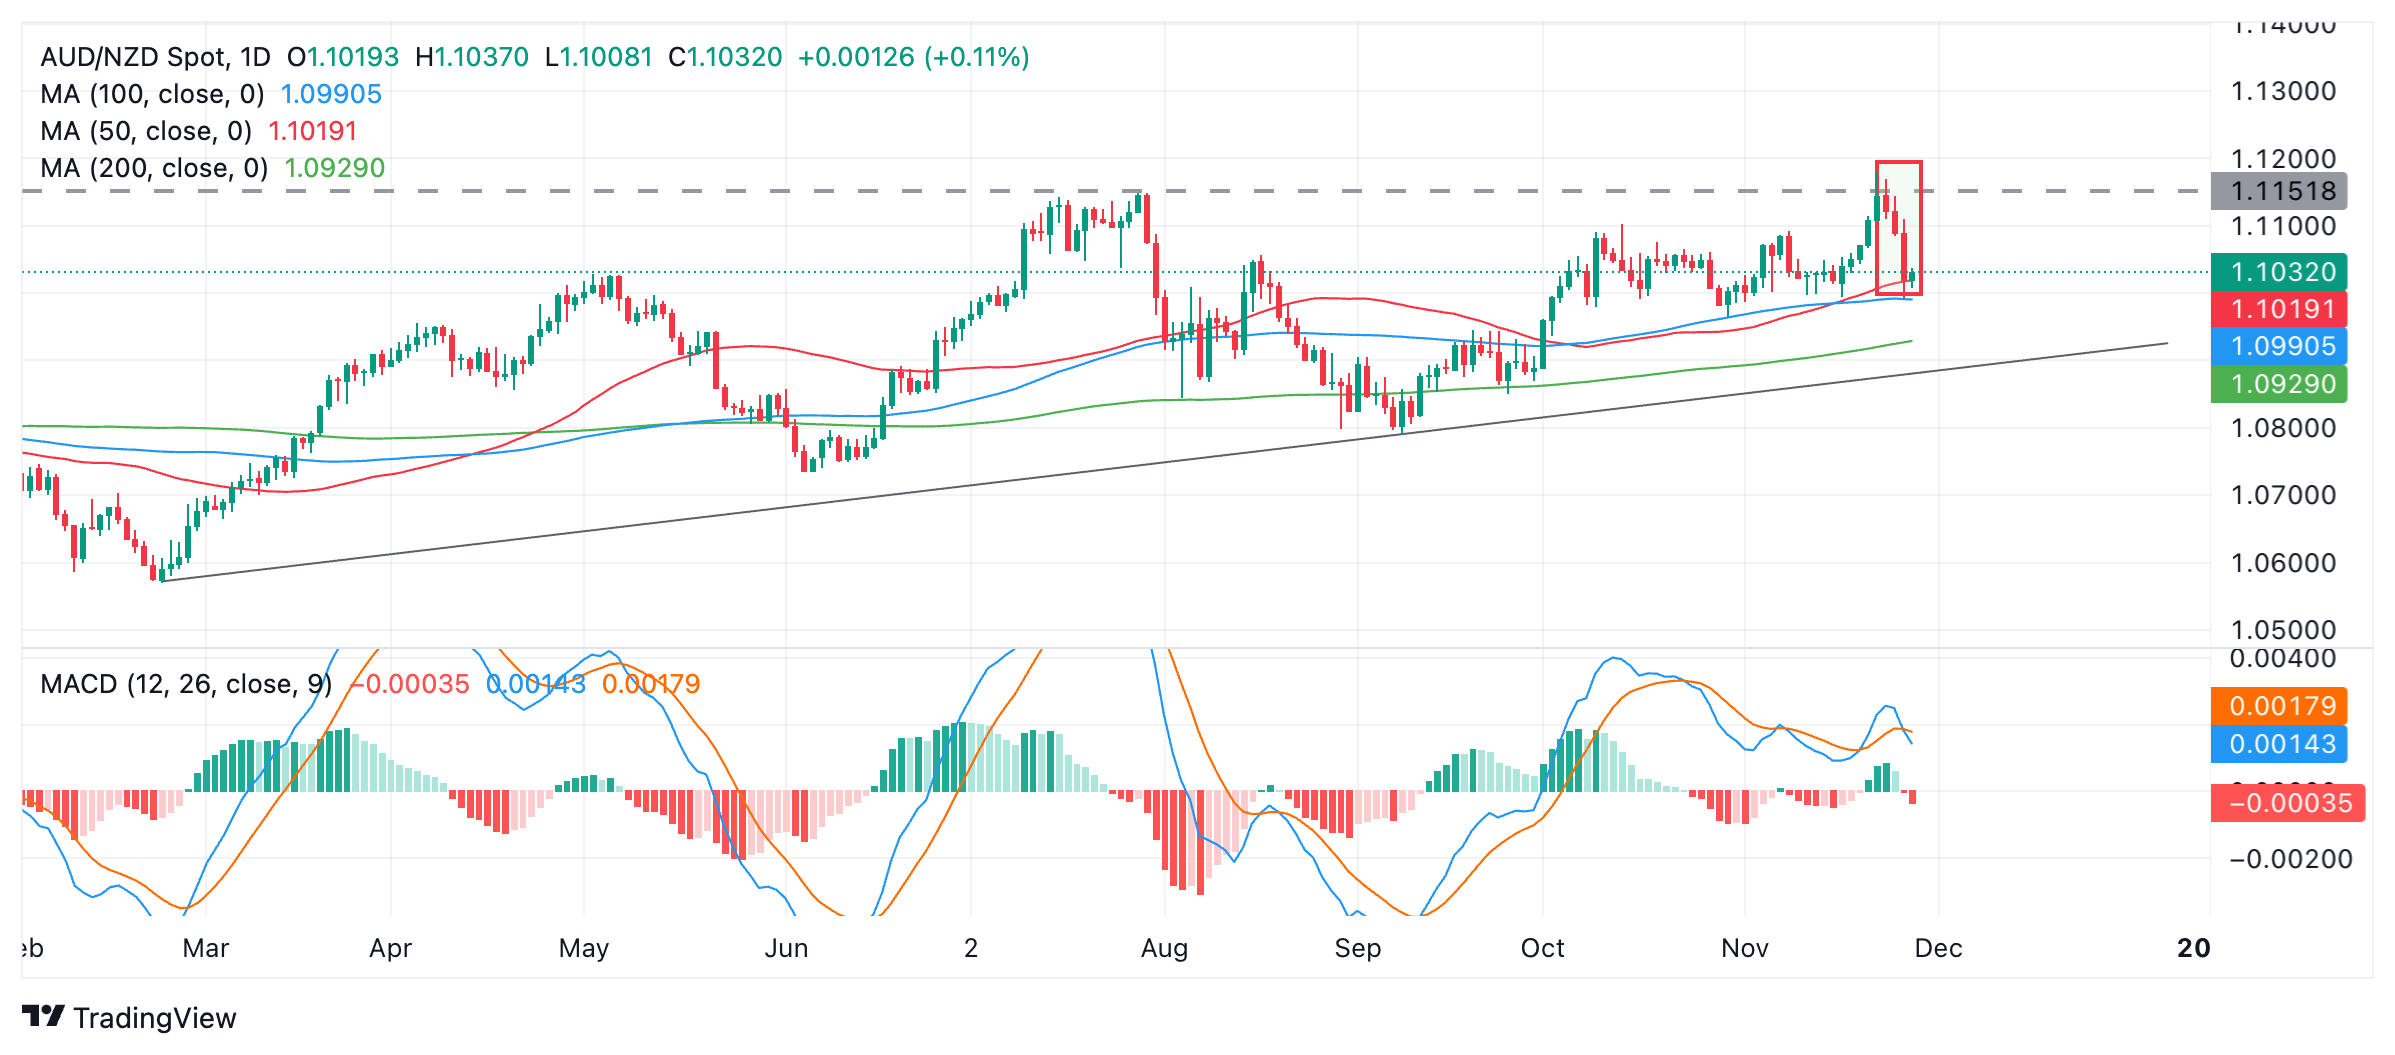
The Three Black Crows is a Japanese candlestick pattern which occurs after a market peak, when three red down days occur consecutively. Such a pattern indicates the odds favor AUD/NZD moving to lower lows. 

The (blue) Moving Average Convergence Divergence (MACD) has crossed below its red signal line, giving a sell signal and reinforcing the bearish candlestick pattern. 

Support lies first at the 200-day Simple Moving Average (SMA) at 1.9029 and then at the trendline for the broader uptrend at around 1.0900. 

A break below the low of the Three Black Crows at 1.0992 would confirm a continuation to the above-mentioned targets. 

Author

Joaquin Monfort

Joaquin Monfort is a financial writer and analyst with over 10 years experience writing about financial markets and alt data. He holds a degree in Anthropology from London University and a Diploma in Technical analysis.

More from Joaquin Monfort
Share:

Editor's Picks

AUD/USD stays bid above 0.7100 on Australian trade data, Mideast optimism

AUD/USD clings to minor recovery gains above 0.7100 in the Asian session on Thursday as a new Israel-Lebanon ceasefire keeps a lid on the safe-haven US Dollar. Meanwhile, strong AustralianTrade Balane data also help the Aussie pair sustain the bounce from weekly lows.

USD/JPY hovers near the 160.00 intervention threshold on Mideast tensions

USD/JPY struggles to find acceptance above 160.00 and retreats from a one-month high in the Asian session on Thursday amid fears that authorities will step in again to prop up the Japanese Yen. Furthermore, a new Israel-Lebanon ceasefire caps the US Dollar and supports the currency pair. However, renewed US-Iran tensions keep the downside limited in the Greenback and the pair.

Gold defends 200-day SMA; upside seems capped on Iran uncertainty

Gold recovers from a one-week low near $4,425, or the 200-day SMA, in the Asian session on Thursday, as news of an Israel-Lebanon ceasefire acts as a headwind for the safe-haven US Dollar. However, renewed hostilities in the Gulf, along with stalled US-Iran peace talks, keep geopolitical risks in play and should support the USD, checking the Gold price rebound.


Ethereum: Long-term holders' capitulation drives ETH below $1,800

Ethereum has fallen below $1,800 on Wednesday, the first time since May 2025 following accelerated spot selling pressure and distributions from long-term holders. The Age Consumed metric, which tracks the movement of previously idle tokens or long-term holders' coins, spiked over the past two days as prices declined, indicating increased selling activity among this cohort.

Kevin Warsh takes the Fed helm: What it means for the US Dollar
The Federal Reserve moves away from the highly predictable "forward guidance" model of the Jerome Powell era to a new “Kevin Warsh environment”, characterized by less communication, more policy surprises, and an increased focus on the Fed's complex balance sheet.
Recession on paper: What really moves the Canadian Loonie now?

Statistics Canada handed the headline writers a gift and the analysts a headache. Real GDP shrank 0.1% on an annualized basis in the first quarter, and with the fourth quarter of 2025 revised down to a 1.0% contraction, that is two negative quarters in a row, the textbook definition of a technical recession and Canada's first since the pandemic.