|

AUD/NZD Price Forecast: Looks to be forming bearish reversal pattern

  • AUD/NZD is probably forming a bearish reversal pattern after peaking in late November. 
  • The MACD could be about to offer a sell signal reinforcing the pattern.
     

AUD/NZD has fallen for the third consecutive day after peaking at the November 25 multi-month high.

If Wednesday ends with a bearish close it will signal the completion of a bearish Three Black Crows candlestick reversal pattern (red rectangle on chart). Such a pattern would indicate the odds favor AUD/NZD falling to lower lows. 

AUD/NZD Daily Chart 

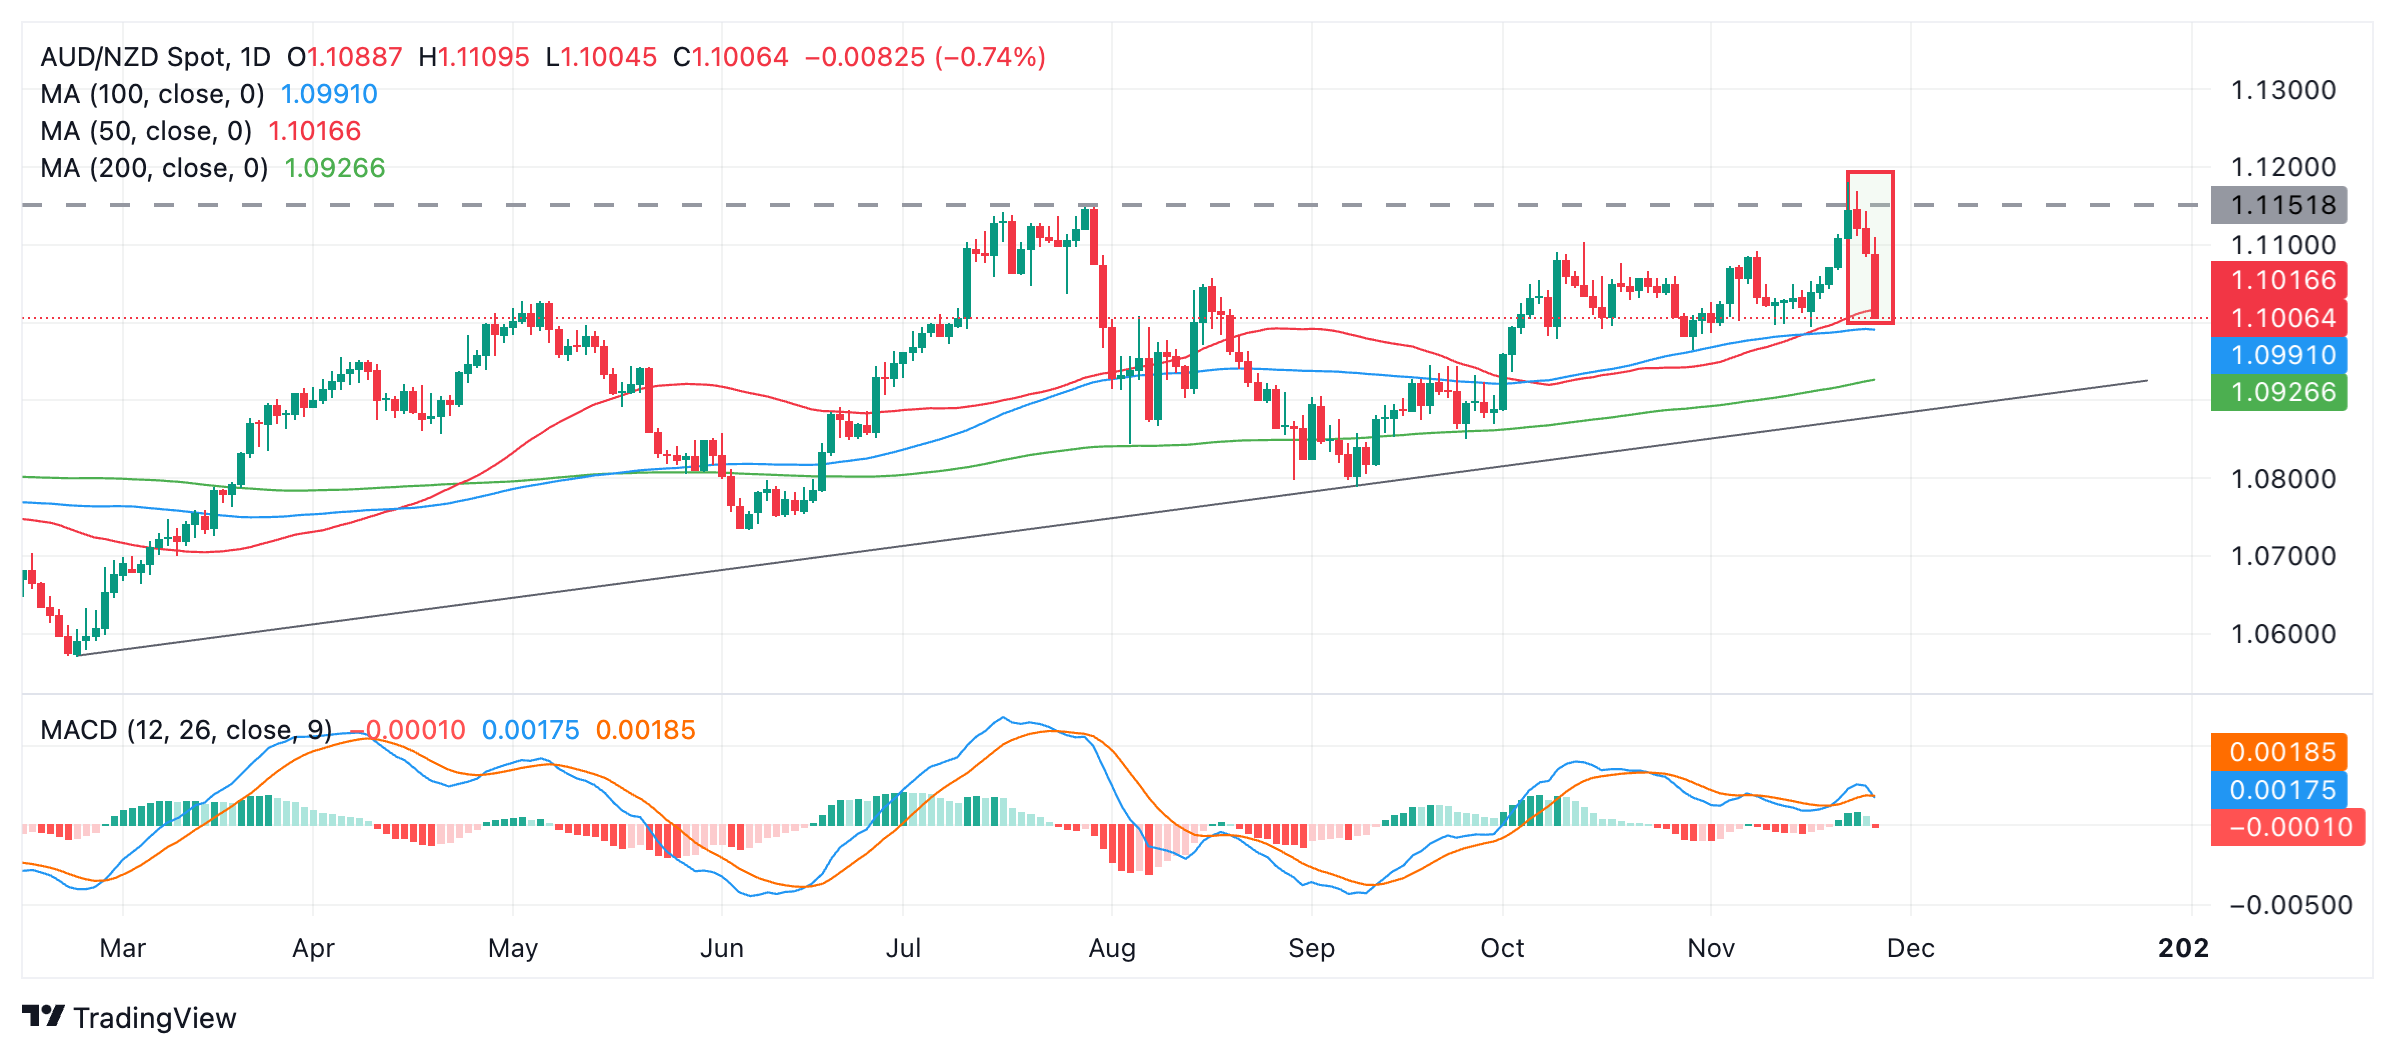
The (blue) Moving Average Convergence Divergence (MACD) is crossing below its red signal line, giving a sell signal and reinforcing the bearish candlestick pattern. The crossover is only on an intraday basis, however, and MACD would need to end the day below the signal line to confirm the bearish bias. 

Support lies at around 1.0900 – 1.0920 at the trendline for the broader uptrend. Assuming the pattern and MACD signal are confirmed, price will probably fall to that zone and consolidate. 

Author

Joaquin Monfort

Joaquin Monfort is a financial writer and analyst with over 10 years experience writing about financial markets and alt data. He holds a degree in Anthropology from London University and a Diploma in Technical analysis.

More from Joaquin Monfort
Share:

Editor's Picks

AUD/USD stays bid above 0.7100 on Australian trade data, Mideast optimism

AUD/USD clings to minor recovery gains above 0.7100 in the Asian session on Thursday as a new Israel-Lebanon ceasefire keeps a lid on the safe-haven US Dollar. Meanwhile, strong AustralianTrade Balane data also help the Aussie pair sustain the bounce from weekly lows.

USD/JPY hovers near the 160.00 intervention threshold on Mideast tensions

USD/JPY struggles to find acceptance above 160.00 and retreats from a one-month high in the Asian session on Thursday amid fears that authorities will step in again to prop up the Japanese Yen. Furthermore, a new Israel-Lebanon ceasefire caps the US Dollar and supports the currency pair. However, renewed US-Iran tensions keep the downside limited in the Greenback and the pair.

Gold defends 200-day SMA; upside seems capped on Iran uncertainty

Gold recovers from a one-week low near $4,425, or the 200-day SMA, in the Asian session on Thursday, as news of an Israel-Lebanon ceasefire acts as a headwind for the safe-haven US Dollar. However, renewed hostilities in the Gulf, along with stalled US-Iran peace talks, keep geopolitical risks in play and should support the USD, checking the Gold price rebound.


Ethereum: Long-term holders' capitulation drives ETH below $1,800

Ethereum has fallen below $1,800 on Wednesday, the first time since May 2025 following accelerated spot selling pressure and distributions from long-term holders. The Age Consumed metric, which tracks the movement of previously idle tokens or long-term holders' coins, spiked over the past two days as prices declined, indicating increased selling activity among this cohort.

Kevin Warsh takes the Fed helm: What it means for the US Dollar
The Federal Reserve moves away from the highly predictable "forward guidance" model of the Jerome Powell era to a new “Kevin Warsh environment”, characterized by less communication, more policy surprises, and an increased focus on the Fed's complex balance sheet.
Recession on paper: What really moves the Canadian Loonie now?

Statistics Canada handed the headline writers a gift and the analysts a headache. Real GDP shrank 0.1% on an annualized basis in the first quarter, and with the fourth quarter of 2025 revised down to a 1.0% contraction, that is two negative quarters in a row, the textbook definition of a technical recession and Canada's first since the pandemic.