|

AUD/NZD Price Analysis: Marches towards 1.0800 on mixed NZ trade numbers ahead of RBA Minutes

  • AUD/NZD picks up bids to cross three-week-old resistance line despite mixed New Zealand trade numbers for February.
  • New Zealand Trade Balance improved but Exports and Imports eased.
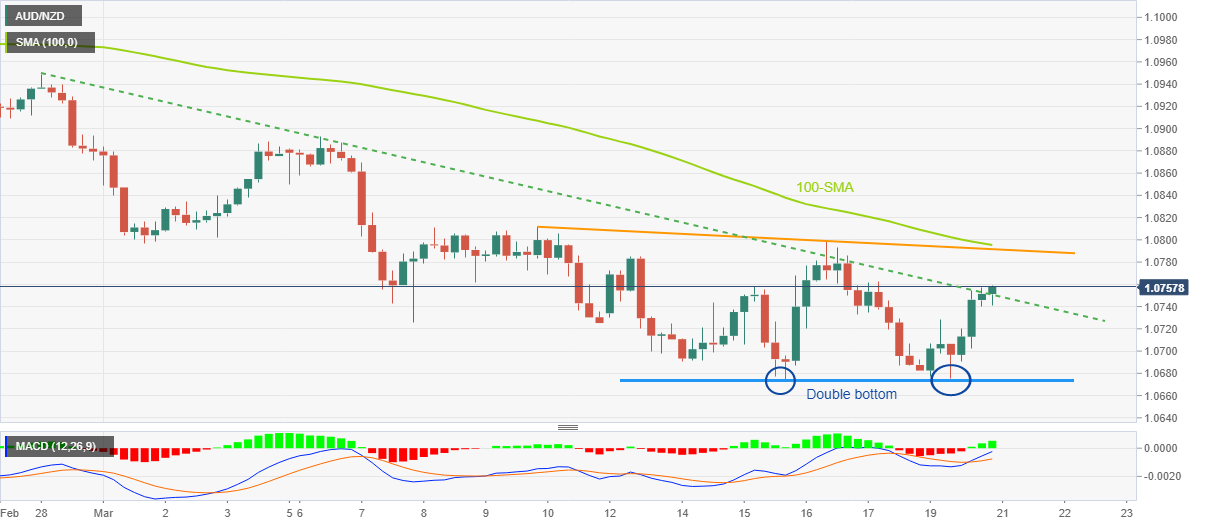
  • “Double bottom” bullish formation lures buyers but 1.0800 is the key hurdle.

AUD/NZD extends the previous day’s strong gains to 1.0760 amid mixed New Zealand trade data, published early Tuesday in Auckland. In doing so, the exotic pair crosses a three-week-old resistance line while highlighting the “double bottom” bullish chart pattern on the four-hour play.

That said, New Zealand’s Trade Balance improved to $-714M in February versus $-1,450M expected and $-2,113M prior (revised). However, the Imports eased to $5.95B from $7.42B while the Exports also declined to $5.23B compared to $5.30B prior during the stated period.

Given the double bottom formation and the quote’s sustained break of the previous key resistance line, the AUD/NZD is very much expected to rise further, backed by bullish MACD signals.

However, a one-week-old resistance line joins the 100-SMA to highlight the importance of the 1.0800 as the strong upside resistance.

Should the quote remains firmer past 1.0800, the odds of witnessing a rally toward the early-month high close to 1.0890 can’t be ruled out.

Alternatively, the resistance-turned-support line of near 1.0750 restricts the immediate downside of the AUD/NZD pair, a break of which could drag the quote back to the 1.0700 round figure before challenging the double bottoms surrounding 1.0675.

AUD/NZD: Four-hour chart

Trend: Further upside expected

Additional important levels

Overview
Today last price1.0758
Today Daily Change0.0076
Today Daily Change %0.71%
Today daily open1.0682
 
Trends
Daily SMA201.0836
Daily SMA501.0885
Daily SMA1001.0824
Daily SMA2001.0982
 
Levels
Previous Daily High1.0763
Previous Daily Low1.0682
Previous Weekly High1.0799
Previous Weekly Low1.0675
Previous Monthly High1.1087
Previous Monthly Low1.0877
Daily Fibonacci 38.2%1.0713
Daily Fibonacci 61.8%1.0732
Daily Pivot Point S11.0656
Daily Pivot Point S21.0629
Daily Pivot Point S31.0576
Daily Pivot Point R11.0736
Daily Pivot Point R21.0789
Daily Pivot Point R31.0816

Author

Anil Panchal

Anil Panchal

FXStreet

Anil Panchal has nearly 15 years of experience in tracking financial markets. With a keen interest in macroeconomics, Anil aptly tracks global news/updates and stays well-informed about the global financial moves and their implications.

More from Anil Panchal
Share:

Markets move fast. We move first.

Orange Juice Newsletter brings you expert driven insights - not headlines. Every day on your inbox.

By subscribing you agree to our Terms and conditions.

Editor's Picks

EUR/USD edges above 1.1750 due to ECB-Fed policy divergence

EUR/USD has recovered its recent losses registered in the previous session, trading around 1.1760 during the Asian hours on Friday. Traders will likely observe Germany’s Manufacturing Purchasing Managers’ Index data later in the day.

GBP/USD gathers strength above 1.3450 on Fed rate cut bets, BoE's gradual policy path

The GBP/USD pair gathers strength to around 1.3480 during the early Asian session on Friday. Expectations of the US Federal Reserve rate cuts this year weigh on the US Dollar against the Pound Sterling. Philadelphia Fed President Anna Paulson is set to speak later on the weekend. 

Gold climbs to near $4,350 on Fed rate cut bets, geopolitical risks

Gold price rises to near $4,345 during the early Asian session on Friday. Gold finished 2025 with a significant rally, achieving an annual gain of around 65%, its biggest annual gain since 1979. The rally of the precious metal is bolstered by the prospect of further US interest rate cuts in 2026 and safe-haven flows.

Bitcoin trades in compression as 2026 begins with structure still unresolved

BTC/USD remains locked in a two-way structure, with micro supply-and-demand levels guiding early-year price behaviour.

Economic outlook 2026-2027 in advanced countries: Solidity test

After a year marked by global economic resilience and ending on a note of optimism, 2026 looks promising and could be a year of solid economic performance. In our baseline scenario, we expect most of the supportive factors at work in 2025 to continue to play a role in 2026.

Crypto market outlook for 2026

Year 2025 was volatile, as crypto often is.  Among positive catalysts were favourable regulatory changes in the U.S., rise of Digital Asset Treasuries (DAT), adoption of AI and tokenization of Real-World-Assets (RWA).