AUD/NZD Price Analysis: Bulls need a break of a critical area of H1 resistance
- AUD/NZD hourly chart bears are lurking near a 78.6% Fibonacci as a potential last defence.
- The price action will likely occur around critical Aussie data today.

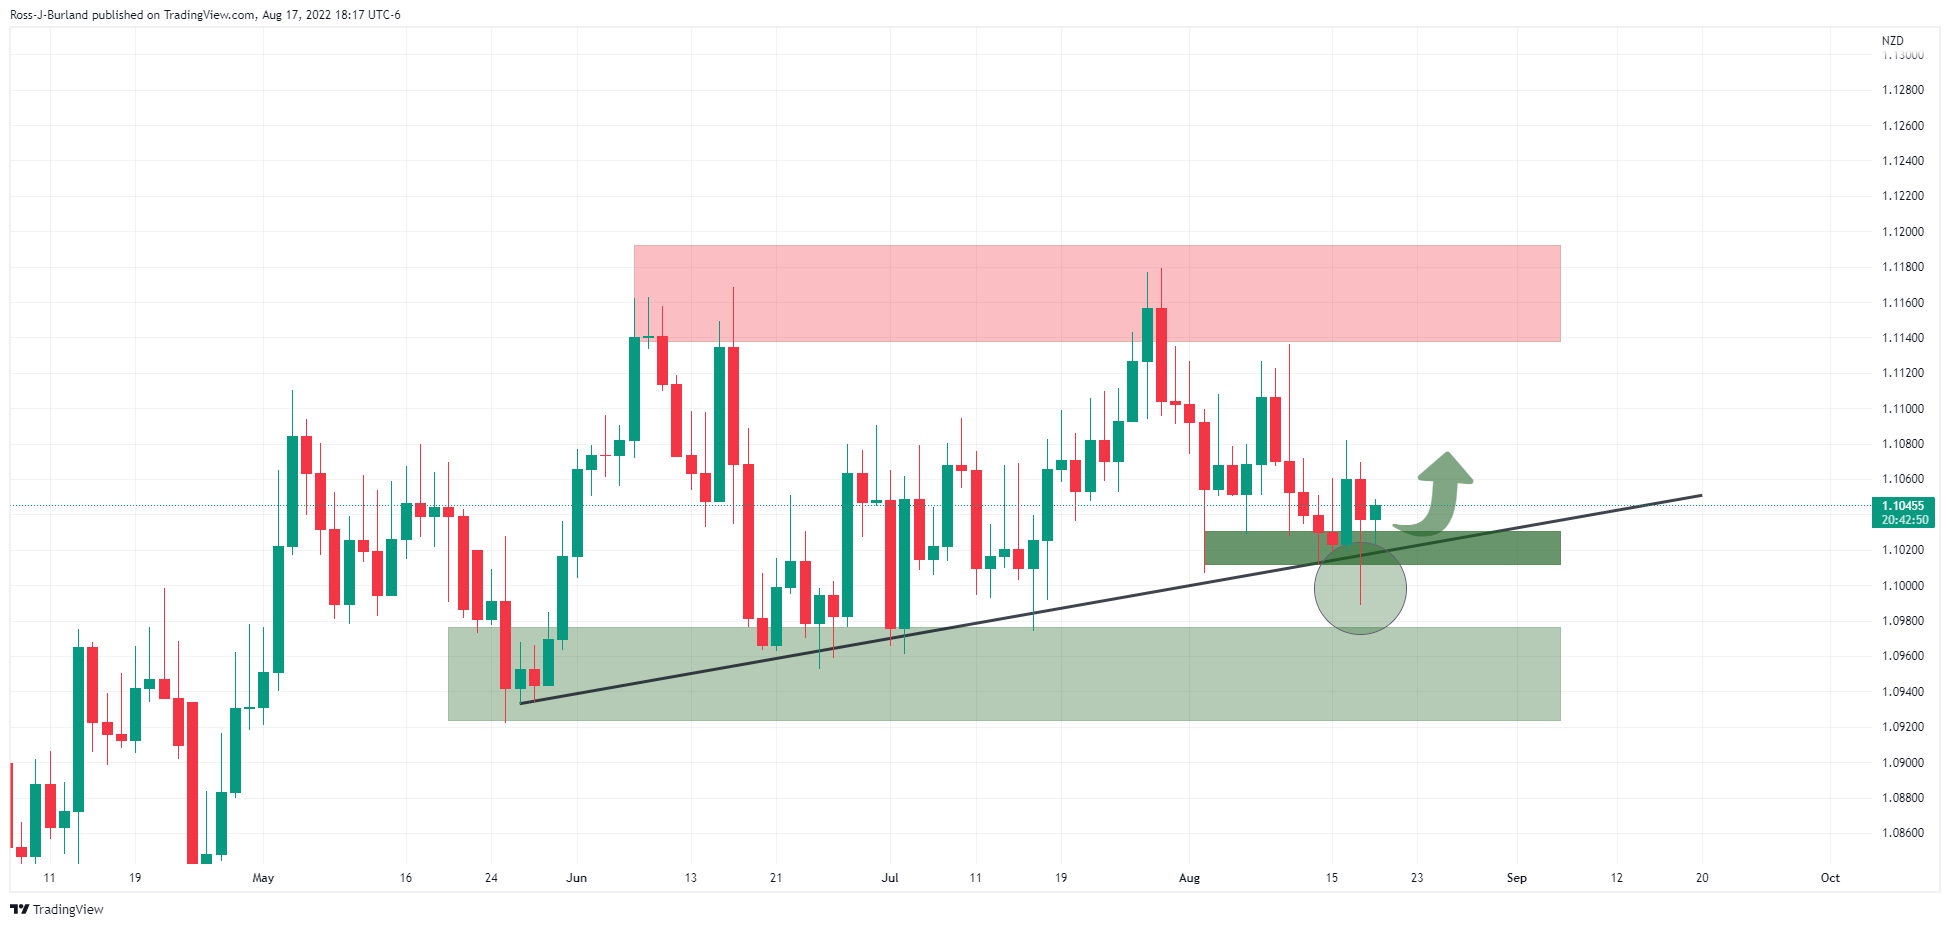
Australian labour market data will be key today but the technicals for AUD/NZD are mixed heading into the data. From a daily perspective, there appears to be a bullish bias considering the wick highlighted below and a subsequent follow-through by the bulls into the day's price action above horizontal support:
AUD/NZD daily chart
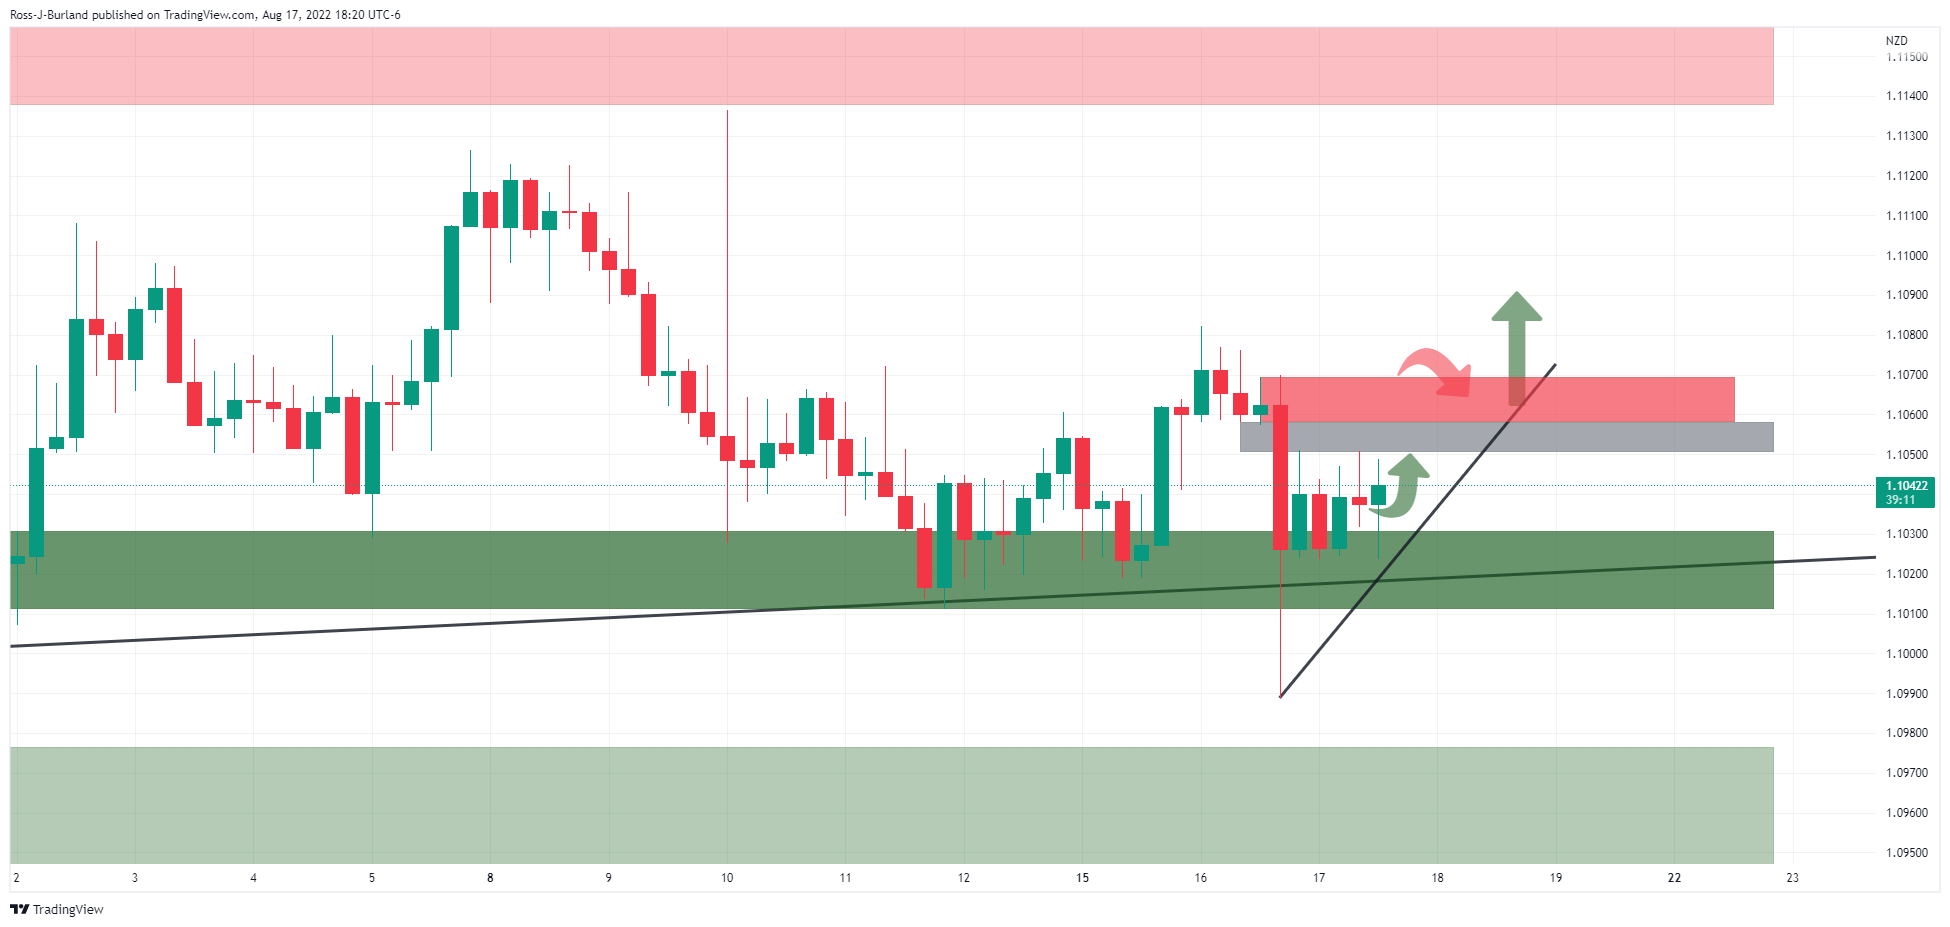
The 4-hour aligns with the daily chart as follows:
AUD/NZD H4 chart
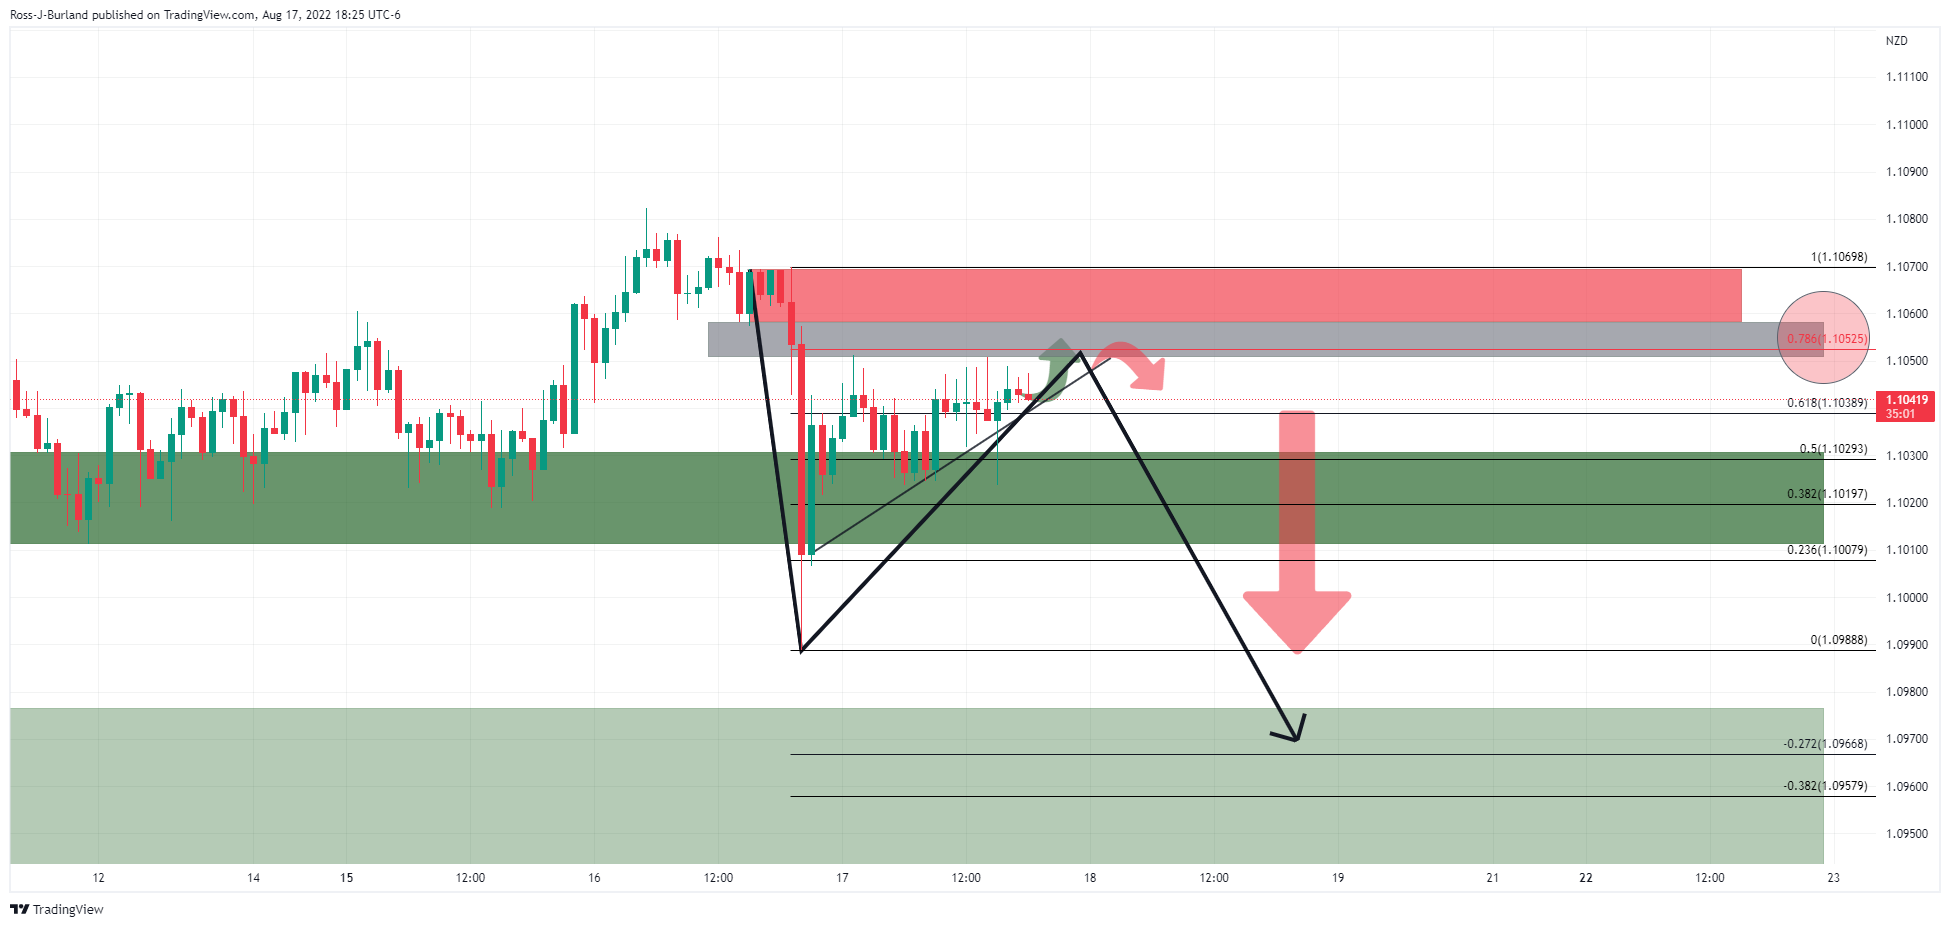
However, the hourly chart shows the price coiled towards an area of imbalance. In mitigating this area, the price will be testing the 78.6% Fibonacci as a potential last defence that could see the price pull back and fall out of the rising support as illustrated below:
AUD/NZD H1 chart
Author

Ross J Burland
FXStreet
Ross J Burland, born in England, UK, is a sportsman at heart. He played Rugby and Judo for his county, Kent and the South East of England Rugby team.


