AUD/JPY technical analysis: Multiple resistance-lines to limit latest recovery
- Near-term trend-line resistances question recent pullback.
- The limited gap on the downside before meeting the year 2016 and early January lows.

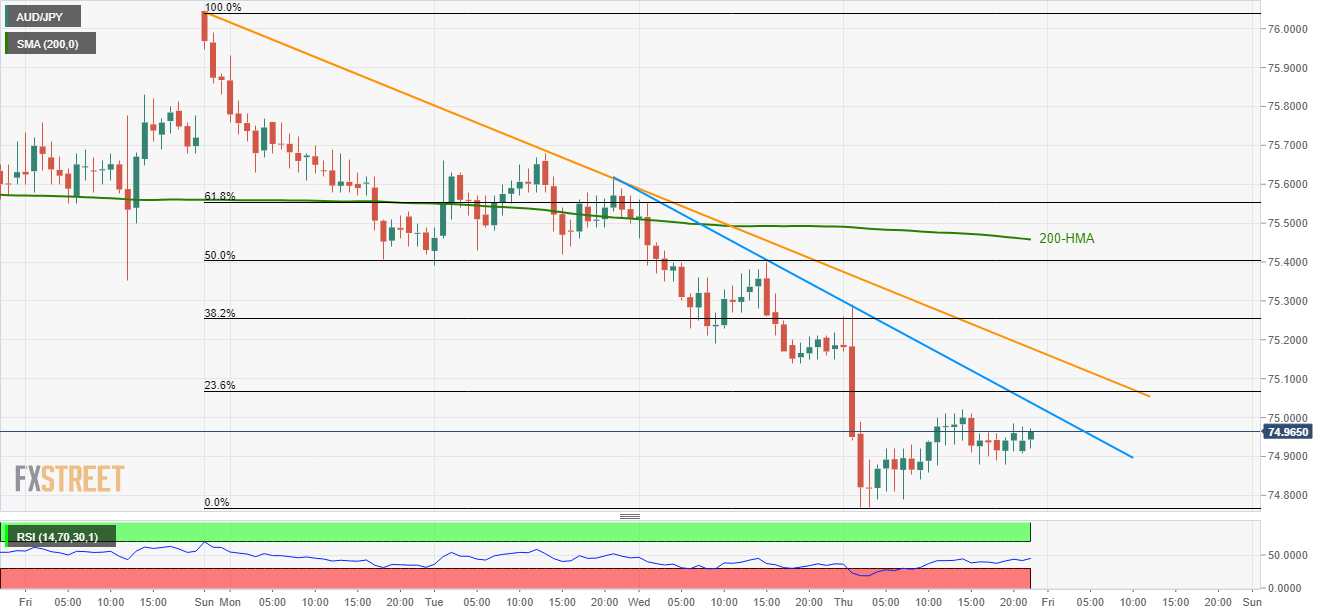
Even if AUD/JPY’s recent short-covering moves from 74.77 presently propels it towards 75.00, near-term descending trend-lines are on the spotlight during early Friday.
Not only a downward sloping resistance-line from late-Tuesday but resistance-line connecting highs since early-week is also likely to challenge the pair’s latest recovery around 75.04 and 75.18 respectively.
Given the prices manage to clear 75.18 resistance, 200-hour moving average (HMA) near 75.46 and current week top near 75.68/70 can please the buyers.
It should also be noted that 74.77 holds the immediate downside confined, a break of which highlights July 2016 low near 74.55 and the year 2016 bottom close to 72.45.
Additionally, pair’s extended south-run below 72.45 can shift market focus to January month flash crash low around 70.90.
AUD/JPY hourly chart
Trend: Bearish
Author

Anil Panchal
FXStreet
Anil Panchal has nearly 15 years of experience in tracking financial markets. With a keen interest in macroeconomics, Anil aptly tracks global news/updates and stays well-informed about the global financial moves and their implications.


