|

AUD/JPY Technical Analysis: Descending triangle limits the upside around 79.20 ahead of RBA minutes
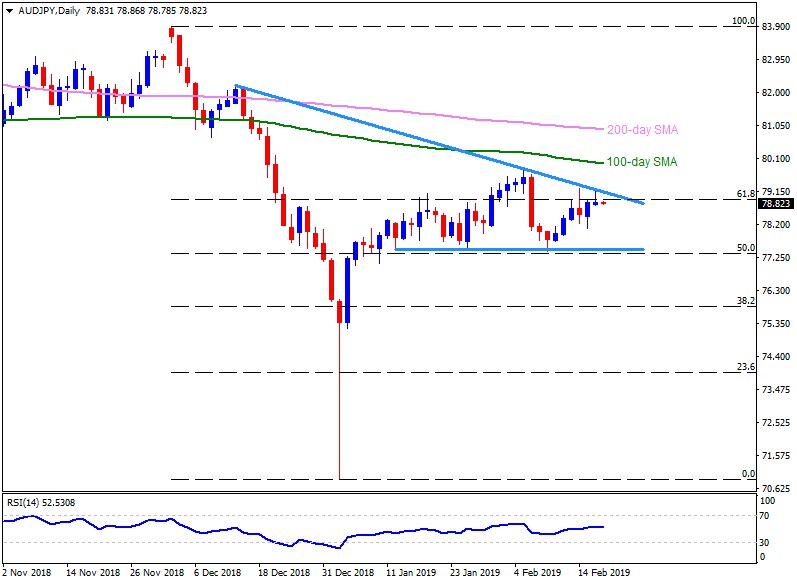
AUD/JPY daily chart

  • AUD/JPY trades little changed around 78.85 before the RBA minutes’ release on early Tuesday.
  • The pair follows a short-term descending triangle formation on the daily chart with 79.20 being immediate resistance to observe.
  • Should the pair cross 79.20 hurdle, it can rise to an early month high around 79.85 whereas 100-day simple moving average (SMA) of 79.95 and the 80.00 may entertain buyers afterward.
  • During the pair’s successful advance above 80.00, the 200-day SMA level of 80.95 can appear on bull’s radar.
  • Alternatively, 78.00 seem nearby support for the pair ahead of highlighting the 77.55-50 support-zone.
  • In case the quote slips under 77.50, 77.00 and 76.00 may gain sellers’ attention.

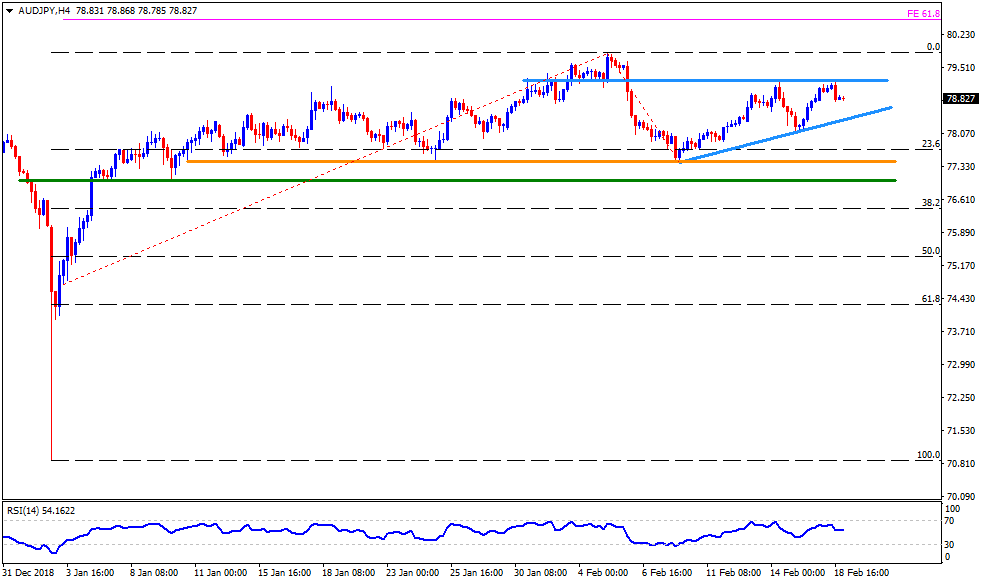
AUD/JPY 4-Hour chart

  • An upward sloping trend-line connecting recent lows offer nearby support to the pair around 78.30 on H4, a break of which can drag it to 78.00.
  • On the upside, 79.20 holds the gate for its rise to 79.85 whereas 61.8% Fibonacci expansion (FE) may please the optimists then after.

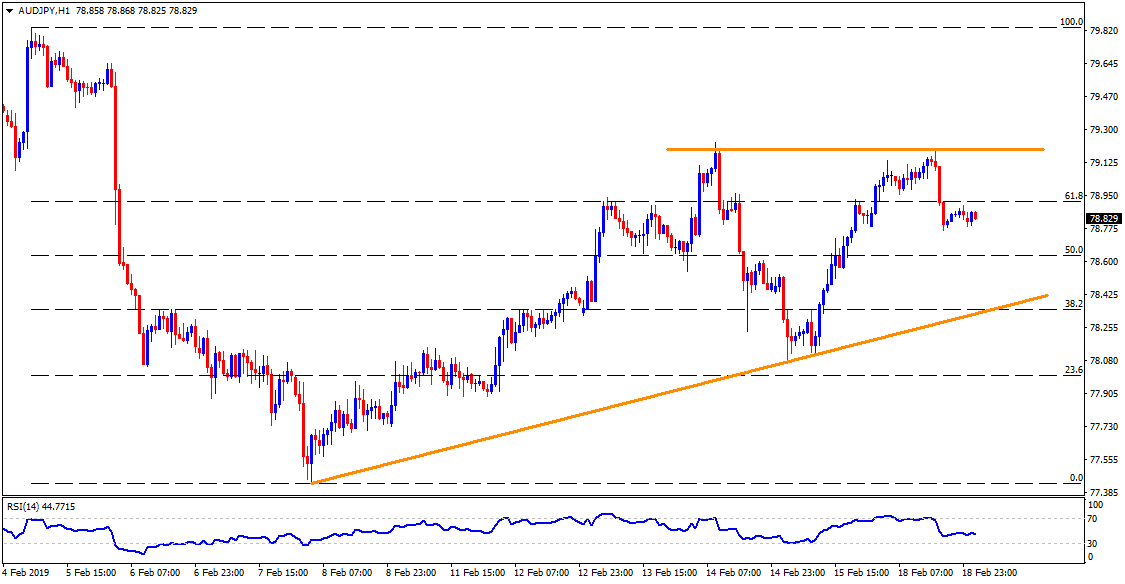
AUD/JPY hourly chart

  • 50% Fibonacci retracement of Feb 05-08 downturn, at 78.60, becomes adjacent support on H1 prior to fetching the quote to 78.30 support-line.
  • An upside clearance of 79.20 may avail 79.50 as a halt before aiming for 79.70 and 79.85 numbers to the north.

Author

Anil Panchal

Anil Panchal

FXStreet

Anil Panchal has nearly 15 years of experience in tracking financial markets. With a keen interest in macroeconomics, Anil aptly tracks global news/updates and stays well-informed about the global financial moves and their implications.

More from Anil Panchal
Share:

Editor's Picks

EUR/USD accelerates losses, focus is on 1.1800

EUR/USD’s selling pressure is gathering pace now, opening the door to a potential test of the key 1.1800 region sooner rather than later. The pair’s pullback comes on the back of marked gains in the US Dollar following US data releases and the publication of the FOMC Minutes later in the day.

GBP/USD turns negative near 1.3540

GBP/USD reverses its initial upside momentum and is now adding to previous declines, revisiting at the same time the 1.3540 region on Wednesday. Cable’s downtick comes on the back of decent gains in the Greenback and easing UK inflation figures, which seem to have reinforced the case for a BoE rate cut in March.

Gold regains some shine, retargets $5,000 ahead of FOMC Minutes

Gold gathers fresh upside traction on Wednesday, leaving part of the weakness seen at the beginning of the week and refocusing its attention to the key $5,000 mark per troy ounce, all ahead of the release of the FOMC Minutes and despite the modest uptick in the US Dollar.

Fed Minutes to shed light on January hold decision amid hawkish rate outlook

The Minutes of the Fed’s January 27-28 monetary policy meeting will be published today. Details of discussions on the decision to leave the policy rate unchanged will be scrutinized by investors.

Mixed UK inflation data no gamechanger for the Bank of England

Food inflation plunged in January, but service sector price pressure is proving stickier. We continue to expect Bank of England rate cuts in March and June. The latest UK inflation read is a mixed bag for the Bank of England, but we doubt it drastically changes the odds of a March rate cut.

Top 3 Price Prediction: Bitcoin, Ethereum, and Ripple face downside risk as bears regain control

Bitcoin, Ethereum, and Ripple remain under pressure on Wednesday, with the broader trend still sideways. BTC is edging below $68,000, nearing the lower consolidating boundary, while ETH and XRP also declined slightly, approaching their key supports.