AUD/JPY Price Forecast: Slips below 94.00 as Middle East de-escalation lifts safe havens
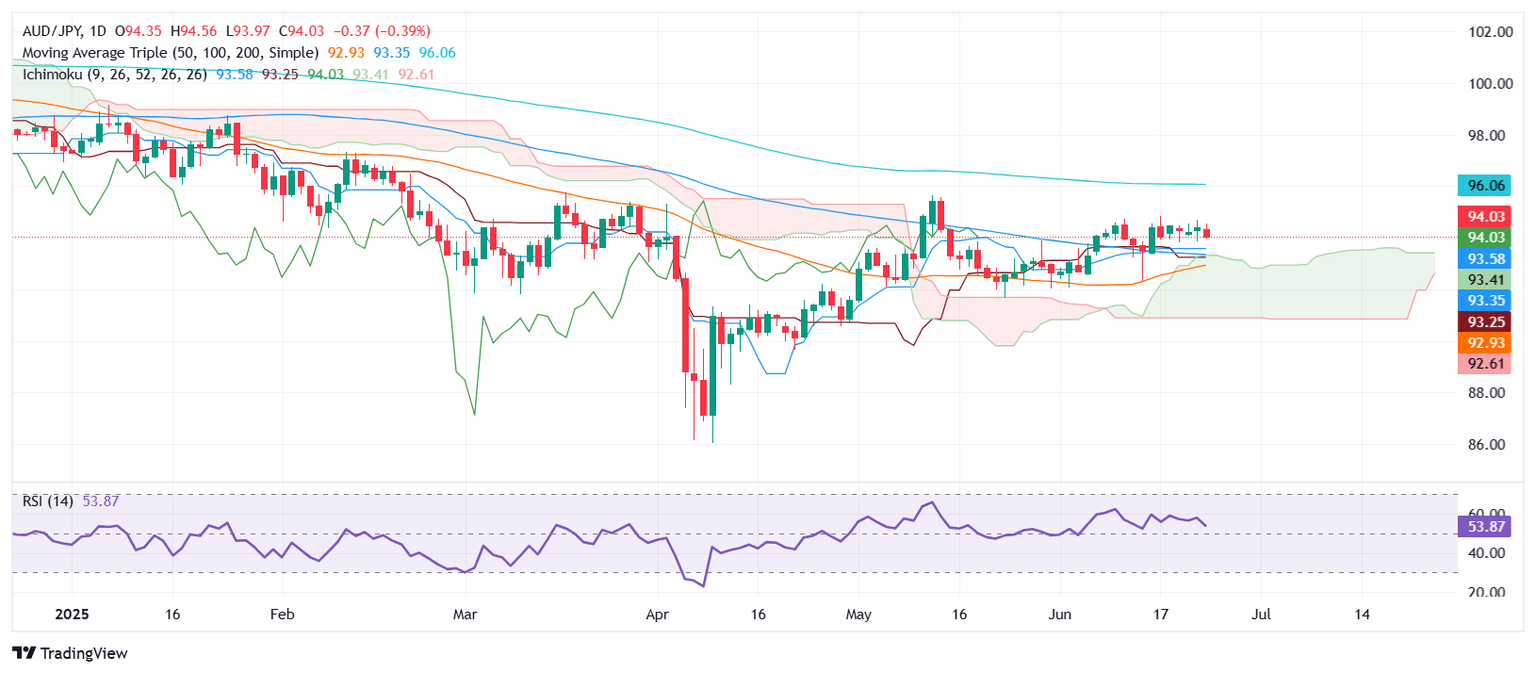
- AUD/JPY is down 0.06% after failing to clear the May 14 peak at 95.56.
- RSI turns slightly lower; mixed signals keep traders focused on price structure.
- Key support at 93.40/56; a break below could expose 93.00 and 92.63 Senkou Span B.

AUD/JPY retreats amid a risk-on mood, spurred by the de-escalation of the Middle East conflict. This pushed safe-haven currencies, except for the US Dollar (USD), higher during Tuesday’s session to the detriment of the Australian Dollar (AUD). At the time of writing, the cross-pair is trading below the 94.00 figure, down 0.06%.
AUD/JPY Price Forecast: Technical Analysis
The trend remains down in the AUD/JPY cross-pair. Even though the Australian Dollar showed signs of strength, its failure to clear the May 14 peak of 95.56 pushed the pair below the 94.00 figure, although it meanders around the latter.
In the short term, the Relative Strength Index (RSI) aims slightly lower, though it remains bullish. The mixed readings leave us as traders focused on price action.
Hence, if AUD/JPY clears the confluence of the Tenkan-sen and the Senkou Span A at around 93.40/56, look for a test of the Kijun-sen at 93.23. On further weakness, 93.00 will be exposed, followed by the Senkou Span B at 92.63.
Conversely, if AUD/JPY rises past 94.00, the first resistance would be 95.00, followed by 95.56, the May 14 high. Above this level, the next zone of interest will be the 96.00 figure.
AUD/JPY Price Chart – Daily
Australian Dollar PRICE Today
The table below shows the percentage change of Australian Dollar (AUD) against listed major currencies today. Australian Dollar was the strongest against the Swiss Franc.
| USD | EUR | GBP | JPY | CAD | AUD | NZD | CHF | |
|---|---|---|---|---|---|---|---|---|
| USD | 0.00% | -0.00% | 0.00% | 0.05% | 0.00% | -0.02% | -0.04% | |
| EUR | -0.01% | -0.00% | -0.05% | 0.03% | -0.02% | -0.07% | -0.04% | |
| GBP | 0.00% | 0.00% | -0.02% | 0.02% | 0.00% | -0.07% | -0.01% | |
| JPY | 0.00% | 0.05% | 0.02% | 0.05% | 0.04% | 0.00% | 0.04% | |
| CAD | -0.05% | -0.03% | -0.02% | -0.05% | 0.00% | 0.02% | -0.05% | |
| AUD | 0.00% | 0.02% | -0.01% | -0.04% | -0.01% | -0.11% | 0.02% | |
| NZD | 0.02% | 0.07% | 0.07% | -0.01% | -0.02% | 0.11% | 0.05% | |
| CHF | 0.04% | 0.04% | 0.00% | -0.04% | 0.05% | -0.02% | -0.05% |
The heat map shows percentage changes of major currencies against each other. The base currency is picked from the left column, while the quote currency is picked from the top row. For example, if you pick the Australian Dollar from the left column and move along the horizontal line to the US Dollar, the percentage change displayed in the box will represent AUD (base)/USD (quote).
Author

Christian Borjon Valencia
FXStreet
Christian Borjon began his career as a retail trader in 2010, mainly focused on technical analysis and strategies around it. He started as a swing trader, as he used to work in another industry unrelated to the financial markets.


