AUD/JPY Price Forecast: Pulls back from nine-day EMA near 97.50
- AUD/JPY may approach the psychological support level at 96.00.
- The bearish sentiment persists as the 14-day RSI continues to stay below the 50 mark.
- The currency cross could retest the nine-day EMA at the 97.26 level.

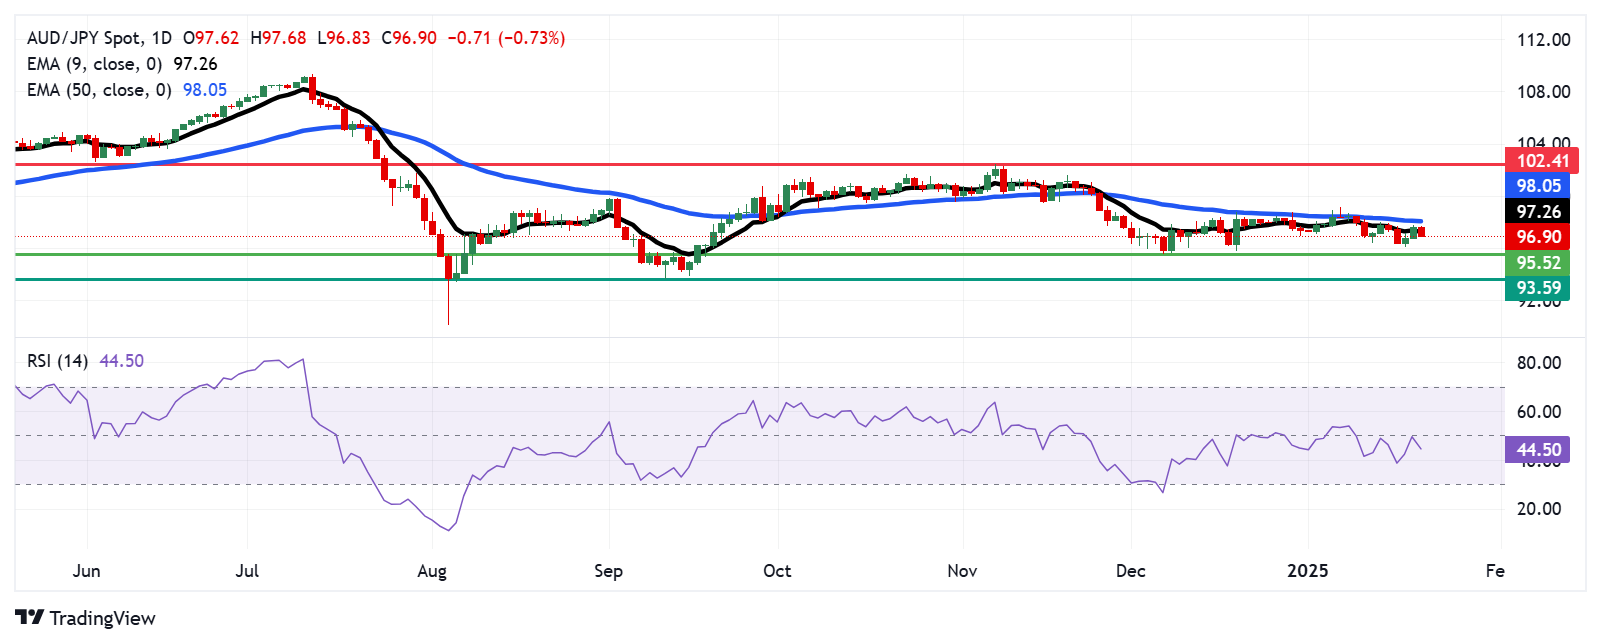
The AUD/JPY cross halts its two-day winning streak, trading around 97.00 during the Asian hours on Tuesday. The 14-day Relative Strength Index (RSI) remains slightly below the 50 level, indicating a bearish momentum is still in play. If the RSI rises above 50, it would signal an emergence of a bullish bias.
Additionally, a review of the daily chart indicates that the AUD/JPY cross remains below nine- and 14-day Exponential Moving Averages (EMAs). This suggests that short-term price momentum is weaker compared to the longer-term trend, signaling the potential for continued price weakness.
The initial support for the AUD/JPY cross is located at the psychological level of 96.00, followed by the four-month low at 95.52. A break below this level could strengthen the bearish bias and push the currency cross to navigate the area around its five-month low at 93.59, which was recorded on September 11.
On the upside, the AUD/JPY cross could test its primary resistance at the nine-day EMA of 97.26, followed by the 50-day EMA at the 98.05 level. A decisive break above this level would signal strengthening short-term price momentum, potentially driving the currency cross toward the six-month high of 102.41, last reached on November 7.
AUD/JPY: Daily Chart
Australian Dollar PRICE Today
The table below shows the percentage change of Australian Dollar (AUD) against listed major currencies today. Australian Dollar was the weakest against the Japanese Yen.
| USD | EUR | GBP | JPY | CAD | AUD | NZD | CHF | |
|---|---|---|---|---|---|---|---|---|
| USD | 0.27% | 0.26% | -0.37% | 0.76% | 0.36% | 0.30% | 0.08% | |
| EUR | -0.27% | -0.01% | -0.60% | 0.49% | 0.09% | 0.03% | -0.20% | |
| GBP | -0.26% | 0.00% | -0.63% | 0.50% | 0.09% | 0.04% | -0.18% | |
| JPY | 0.37% | 0.60% | 0.63% | 1.12% | 0.71% | 0.64% | 0.43% | |
| CAD | -0.76% | -0.49% | -0.50% | -1.12% | -0.40% | -0.46% | -0.68% | |
| AUD | -0.36% | -0.09% | -0.09% | -0.71% | 0.40% | -0.06% | -0.27% | |
| NZD | -0.30% | -0.03% | -0.04% | -0.64% | 0.46% | 0.06% | -0.23% | |
| CHF | -0.08% | 0.20% | 0.18% | -0.43% | 0.68% | 0.27% | 0.23% |
The heat map shows percentage changes of major currencies against each other. The base currency is picked from the left column, while the quote currency is picked from the top row. For example, if you pick the Australian Dollar from the left column and move along the horizontal line to the US Dollar, the percentage change displayed in the box will represent AUD (base)/USD (quote).
Author

Akhtar Faruqui
FXStreet
Akhtar Faruqui is a Forex Analyst based in New Delhi, India. With a keen eye for market trends and a passion for dissecting complex financial dynamics, he is dedicated to delivering accurate and insightful Forex news and analysis.


