AUD/JPY Price Forecast: Drops to near 98.50 due to weakening short-term price momentum
- AUD/JPY continues its losing streak due to a strengthening bearish bias.
- A corrective rebound could be indicated if the 14-day RSI breaks below the 30 level.
- The currency cross may navigate the region around its four-month low of 93.59.

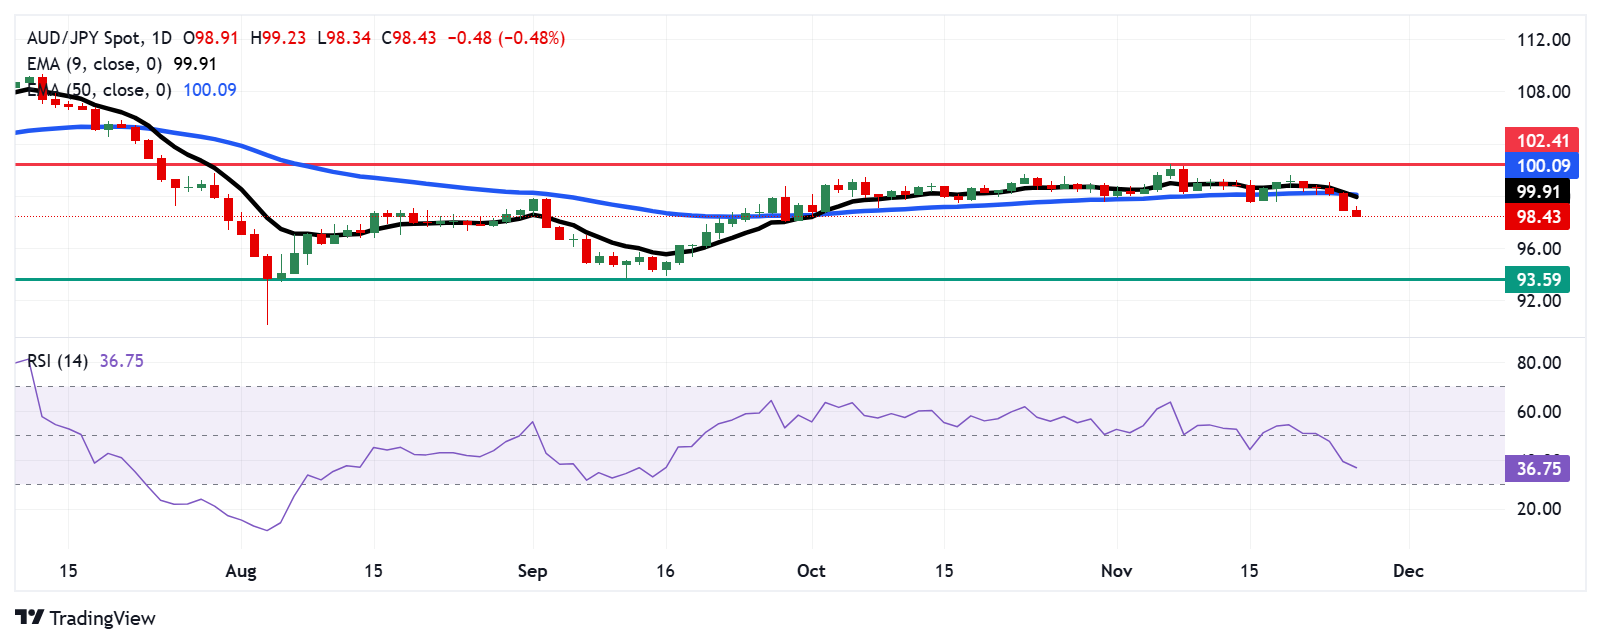
The AUD/JPY cross extends its losing streak for the fifth consecutive day, trading around 98.40 during the European hours on Wednesday. The 14-day Relative Strength Index (RSI) is currently above 30, indicating a bearish market trend. If the RSI drops below 30, it would signal an oversold condition, potentially leading to a corrective rebound.
Additionally, an analysis of the daily chart suggests that the nine-day Exponential Moving Average (EMA) crosses below the 50-day EMA, suggesting a bearish signal. This crossover indicates that the short-term momentum is weakening relative to the longer-term trend, which could signify the continued price weakness.
On the downside, the primary support for the AUD/JPY cross is located around the psychological level of 97.00, followed by the next support at 96.00 level. A decisive break below the latter could open the gates for the currency cross to navigate the region around its four-month low of 93.59, which was recorded on September 11.
To the upside, the AUD/JPY cross may test the primary resistance around the nine-day EMA at 99.92 level, followed by the 50-day EMA at 100.09 level. A break above these levels could weaken the bearish bias, potentially pushing the currency cross toward the four-month high of 102.41, reached on November 7.
AUD/JPY: Daily Chart
Australian Dollar PRICE Today
The table below shows the percentage change of Australian Dollar (AUD) against listed major currencies today. Australian Dollar was the weakest against the New Zealand Dollar.
| USD | EUR | GBP | JPY | CAD | AUD | NZD | CHF | |
|---|---|---|---|---|---|---|---|---|
| USD | -0.33% | -0.31% | -0.88% | -0.07% | -0.36% | -0.99% | -0.41% | |
| EUR | 0.33% | 0.00% | -0.56% | 0.25% | -0.04% | -0.66% | -0.05% | |
| GBP | 0.31% | -0.01% | -0.57% | 0.24% | -0.04% | -0.67% | -0.09% | |
| JPY | 0.88% | 0.56% | 0.57% | 0.81% | 0.52% | -0.11% | 0.48% | |
| CAD | 0.07% | -0.25% | -0.24% | -0.81% | -0.30% | -0.92% | -0.33% | |
| AUD | 0.36% | 0.04% | 0.04% | -0.52% | 0.30% | -0.62% | -0.05% | |
| NZD | 0.99% | 0.66% | 0.67% | 0.11% | 0.92% | 0.62% | 0.58% | |
| CHF | 0.41% | 0.05% | 0.09% | -0.48% | 0.33% | 0.05% | -0.58% |
The heat map shows percentage changes of major currencies against each other. The base currency is picked from the left column, while the quote currency is picked from the top row. For example, if you pick the Australian Dollar from the left column and move along the horizontal line to the US Dollar, the percentage change displayed in the box will represent AUD (base)/USD (quote).
Author

Akhtar Faruqui
FXStreet
Akhtar Faruqui is a Forex Analyst based in New Delhi, India. With a keen eye for market trends and a passion for dissecting complex financial dynamics, he is dedicated to delivering accurate and insightful Forex news and analysis.


