|

AUD/JPY Price Analysis: Trapped between the 81.00-70 range

  • The AUD/JPY advances for the first day out of the last three, up some 0.09%.
  • A risk-off market mood keeps investors flowing through safe-haven assets, thus favoring the Japanese yen.
  • The AUD/JPY is downward biased, but the price action is under consolidations as portrayed by the last two trading days.

Despite the financial markets' risk-off mood, the Australian dollar snaps three consecutive days of losses advances some 0.09%. At the time of writing, the AUD/JPY is trading at 81.47.

Market participants are getting ready for the Federal Reserve to unveil its first monetary policy statement of the year. Investors have already priced in a 25 bps rate hike in the March meeting, but the questions that remain to be answered by the Fed are the pace of the Quantitative Tightening (QT) and when it will start. Alongside the uncertainty of the US central bank tightening,  geopolitical events keep the USD and the JPY on the right foot, to the detriment of risk-sensitive currencies.

The conflict between Ukraine and Russia has been escalating in the last week. The US Department of Defense maintains 8,500 American troops on heightened alert and could be deployed if Russia invades Ukraine.

On Tuesday, the AUD/JPY remained in the 81.05-81.78 range, seesawing around the 50-hour simple moving average (SMA), with no apparent bias, trapped around the latter and the 100-hour SMA at 81.83.

AUD/JPY Price Forecast: Technical outlook

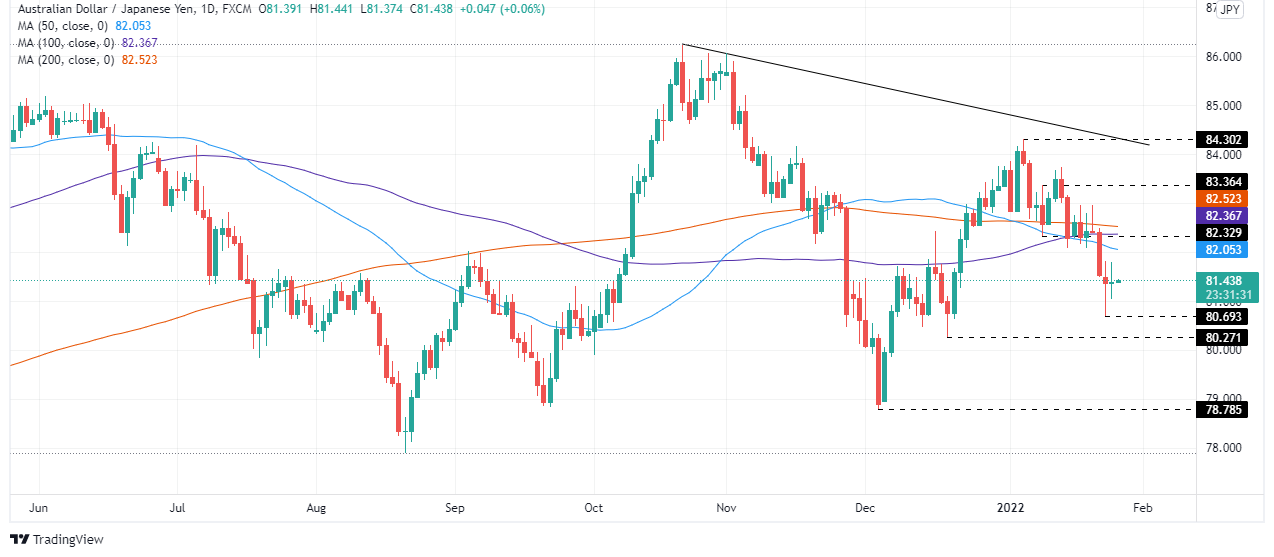
From a technical perspective, Monday's AUD/JPY price action witnessed a jump from the YTD lows around 80.69, which pushed the pair above the 81.00 handle, courtesy of the recovery of the US stock market by the end of the day. That said, on Tuesday, a doji emerged, which could be the signal of a pause of the downtrend or might be an early signal of a reversal candle pattern. 

To the upside, the AUD/JPY first resistance level would be the 50-day moving average (DMA) at 82.05. A breach of the latter would expose the confluence of the January 10 daily low previous support-turned-resistance and the 100-DMA in the 82.33-37 range, that once broken, would give way for a test of the 200-DMA at 82.52.

On the flip side, the first support would be 81.00. A break under that level will keep bears in control and will open the door for further gains. The next demand area would be the January 24 daily low at 80.69, followed by December 20, 2021, daily low at 80.27.
AUD/JPY

Overview
Today last price81.47
Today Daily Change0.07
Today Daily Change %0.09
Today daily open81.4
 
Trends
Daily SMA2082.9
Daily SMA5082.17
Daily SMA10082.41
Daily SMA20082.59
 
Levels
Previous Daily High81.83
Previous Daily Low80.7
Previous Weekly High82.97
Previous Weekly Low81.49
Previous Monthly High83.76
Previous Monthly Low78.79
Daily Fibonacci 38.2%81.13
Daily Fibonacci 61.8%81.4
Daily Pivot Point S180.79
Daily Pivot Point S280.17
Daily Pivot Point S379.65
Daily Pivot Point R181.92
Daily Pivot Point R282.44
Daily Pivot Point R383.05

Author

Christian Borjon Valencia

Markets analyst, news editor, and trading instructor with over 14 years of experience across FX, commodities, US equity indices, and global macro markets.


More from Christian Borjon Valencia
Share:

Editor's Picks

GBP/USD slips toward 1.3350 after soft UK CPI data

GBP/USD erases recovery gains and slips toward 1.3350 in the European session on Wednesday. The UK annual Consumer Price Index (CPI) inflation cooled to 2.6% in June against the market forecast of 2.7%, tempering the British Pound's rebound from weekly troughs. Traders also assess the ongoing Mideast tensions amid a pause in the US Dollar uptrend.

EUR/USD holds above 1.1400 amid US Dollar retreat

EUR/USD holds positive ground above 1.1400 in European trading on Wednesday, helped by hawkish ECB expectations and a broad US Dollar retreat. However, persisting Middle East tensions and surging Oil prices keep the pair's upside elusive.

Gold holds gains above $4,100 undaunted by risk-off markets

Gold extends gains for the fourth consecutive day, standing comfortably above $4,100, unfazed by the risk-off market amid rising tensions in Iran and higher Oil prices. The pair has rallied nearly 2.5% so far this week and is on track for its best weekly performance in more than three months.

Cardano: Short-term recovery lacks retail support

Cardano price edges lower after the 50-day Exponential Moving Average at $1.770 capped two consecutive days of recovery seen earlier this week. ADA futures point to waning retail traction as Open Interest and trading volume decline amid elevated long liquidations. The technical outlook for ADA is bearish, as momentum remains subdued below a resistance trendline near $0.1782.

Chip stocks are more volatile than Oil

I continue to start the day by looking at these two charts: US crude & Kospi. The former is extending gains, trading above $86 per barrel for WTI and $92 per barrel for Brent, while the Kospi is up more than 4.5%, led higher by Korean chipmakers following a similar jump in VanEck's Semiconductor ETF yesterday.

US Dollar mid-year outlook: Exceptional currency, exceptional risks?
The US Dollar enters the second half of 2026 in a markedly different position from a year ago. The King currency has recovered, reflecting persistent US inflation, changing expectations for Fed policy, geopolitical tensions and renewed demand for defensive assets.