|

AUD/JPY Price Analysis: Soars to 1 ½ month high; is 96.00 on the horizon?

  • AUD/JPY rallies to 95.64, its highest level in one-and-a-half months, buoyed by RBA’s latest monetary policy minutes.
  • Following resistance levels in sight: July 25 swing high at 95.85 and the psychological 96.00 mark.
  • Downside risks remain, with key support levels at the Ichimoku Cloud top at 94.74 and the Tenkan-Sen line at 94.60.

The AUD/JPY printed solid gains on Tuesday, and as Wednesday’s Asian session begins, the cross-currency pair hovers around 95.39 after touching a new one-and-a-half-month high at 95.64.

The AUD/JPY daily chart portrays the pair as neutral to upward biased. Even though it formed a ‘bearish-harami’ until yesterday, the cross-currency pair extended its gains due to fundamental news, such as the latest Reserve Bank of Australia (RBA) monetary policy minutes. Discussions amongst the RBA members kept the door open for additional tightening and sparked Tuesday’s rally.

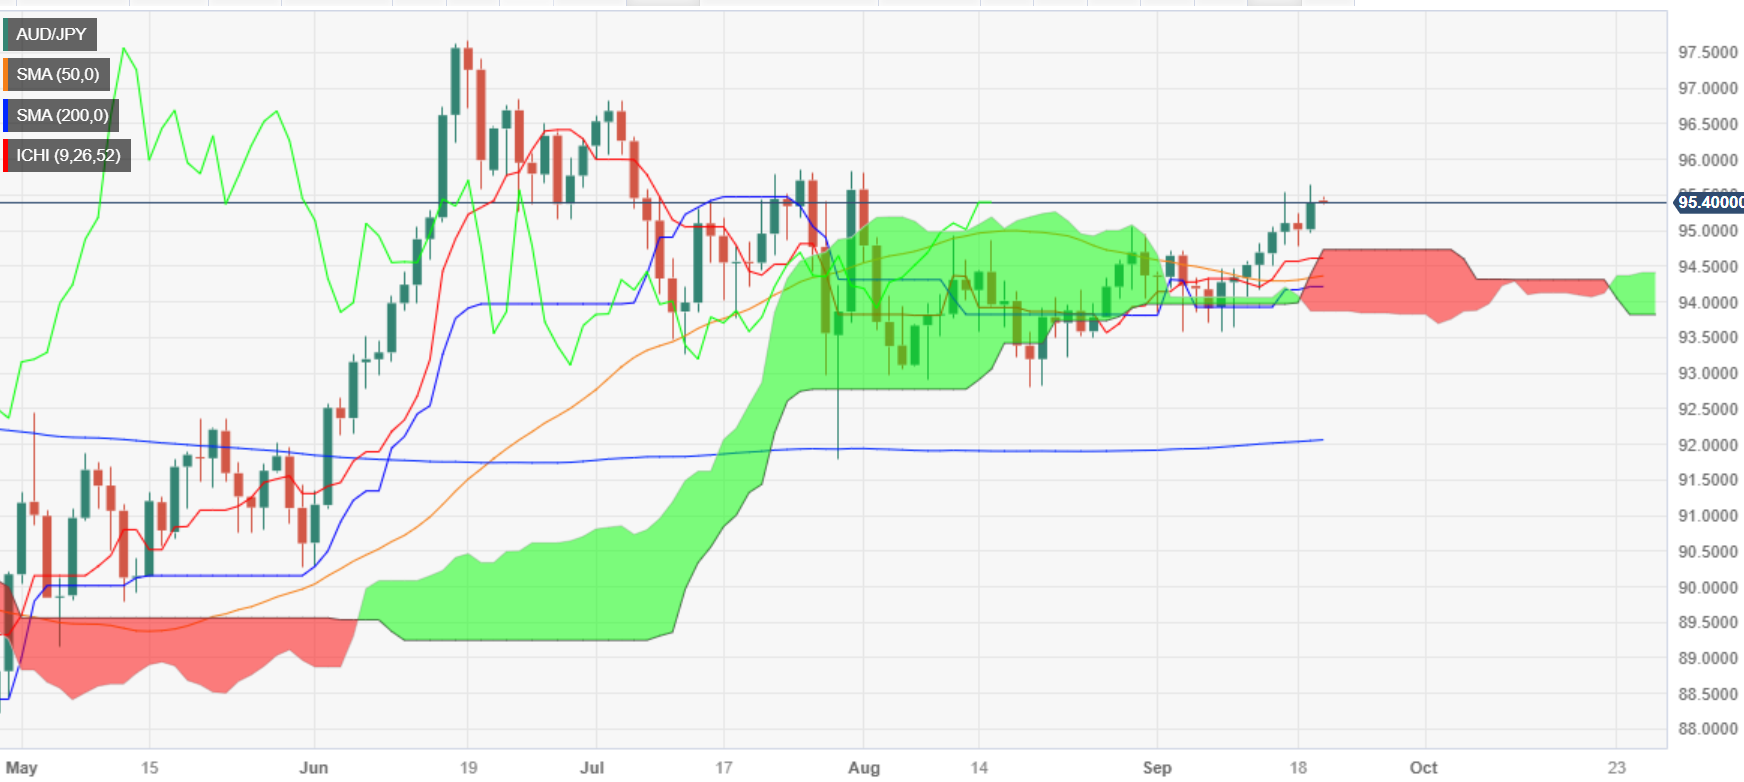
Hence, the AUD/JPY extended its gains and is set to test the July 25 swing high at 95.85. A breach of the latter would expose the 96.00 mark, followed by last year’s high at 97.67. Conversely, if the cross retreats below 95.00, the next support would emerge at the top of the Ichimoku Cloud (Kumo) at 94.74, followed by the Tenkan-Sen line at 94.60, and followed by the Kijun-Sen at 94.21.

AUD/JPY Price Action – Daily chart

AUD/JPY Technical Levels

AUD/JPY

Overview
Today last price95.39
Today Daily Change0.37
Today Daily Change %0.39
Today daily open95.02
 
Trends
Daily SMA2094.35
Daily SMA5094.31
Daily SMA10093.85
Daily SMA20092.04
 
Levels
Previous Daily High95.26
Previous Daily Low94.79
Previous Weekly High95.55
Previous Weekly Low93.65
Previous Monthly High95.81
Previous Monthly Low92.79
Daily Fibonacci 38.2%94.97
Daily Fibonacci 61.8%95.08
Daily Pivot Point S194.79
Daily Pivot Point S294.55
Daily Pivot Point S394.32
Daily Pivot Point R195.25
Daily Pivot Point R295.49
Daily Pivot Point R395.72

Author

Christian Borjon Valencia

Markets analyst, news editor, and trading instructor with over 14 years of experience across FX, commodities, US equity indices, and global macro markets.

More from Christian Borjon Valencia
Share:

Editor's Picks

AUD/USD falls to near 0.7100 after slipping below 50-day EMA

AUD/USD depreciates after registering minor gains in the previous day, trading around 0.7120 during the Asian hours. The technical analysis of the daily chart shows the pair consolidating sideways within a rectangle pattern, as neither bulls nor bears gain control. The AUD/USD pair is holding a slight bearish tone however as it sits beneath both the nine-day and 50-day EMAs.

160.00: USD/JPY back near intervention territory after upbeat US jobs report

US Nonfarm Payrolls beat expectations by a wide margin in May, with 172K jobs added. The US Dollar rebounds after the release, helping USD/JPY recover from its intraday lows. Warnings from Japanese authorities continue to limit upside potential near the 160.00 threshold.

Gold targets $4,300 amid stronger Dollar

Gold faces increasing selling interest and navigates the area of three-month lows near the $4,300 mark per troy ounce on Friday. The precious metal’s decline comes as traders assess the stronger-than-expected NFP, while the bid bias in the Greenback and higher US Treasury yields also collaborate with the retracement.

Cardano hits five-year low even as Hoskinson clarifies "break" isn't an exit

Cardano (ADA) price is down 10% at press time on Friday, extending losses over 30% so far this week amid Charles Hoskinson's clarification that "break" isn't an exit.

Week ahead – Fed countdown begins amid US inflation data and geopolitical risks

Fed Chair Warsh’s first meeting approaches as key US inflation data could reshape expectations. Oil prices remain elevated as US-Iran talks continue; tariffs also return to the spotlight. ECB is expected to hike; will it be a one-off move or is July live?

The US economy defies the rules: 100 days into the Oil shock and the recession signal is still missing

More than three months after the start of the Iran war and the resulting disruption to global energy markets, the US economy continues to display remarkable resilience. The conflict has triggered a sharp rise in Oil prices, reignited inflationary pressures and fueled widespread concerns about a potential economic slowdown.