|

AUD/JPY Price Analysis: Slumps below 94.00 after reaching weekly highs nearby 95.00

  • AUD/JPY faces resistance from Tenkan and Kijun-Sen lines, currently trading just above at 93.93.
  • Downside potential targets include the bottom of the Ichimoku Cloud at 93.45 and the 93.00 psychological level.
  • On the upside, reclaiming 94.00 could see challenges at the August 15 high (94.86) and the Kumo top near 95.00/05.

The AUD/JPY retraces from weekly highs reached during Tuesday’s session at around 94.86, prolonging its losses after cracking a five-month-old upslope support trendline that intersects with the 94.00 mark. At the time of writing, the AUD/JPY is trading at 93.93, down by a minimal 0.01%.

AUD/JPY Price Analysis: Technical outlook

The daily chart portrays the AUD/JPY pair as subdued, capped on the downside by the Tenkan and Kijun-Sen lines at 93.92 and  93.82. If AUD/JPY slides past that area, the next support will emerge at the bottom of the Ichimoky Cloud (Kumo) at 93.45 before challenging 93.00.

Conversely, if AUD/JPY buyers reclaim the 94.00 figure, the first resistance would be the August 15 high of 94.86 ahead of testing the top of the Kumo at around 95.00/05. Once cleared, the next resistance would emerge at 95.83, the July 31 daily high.

AUD/JPY Price Action -  Daily chart
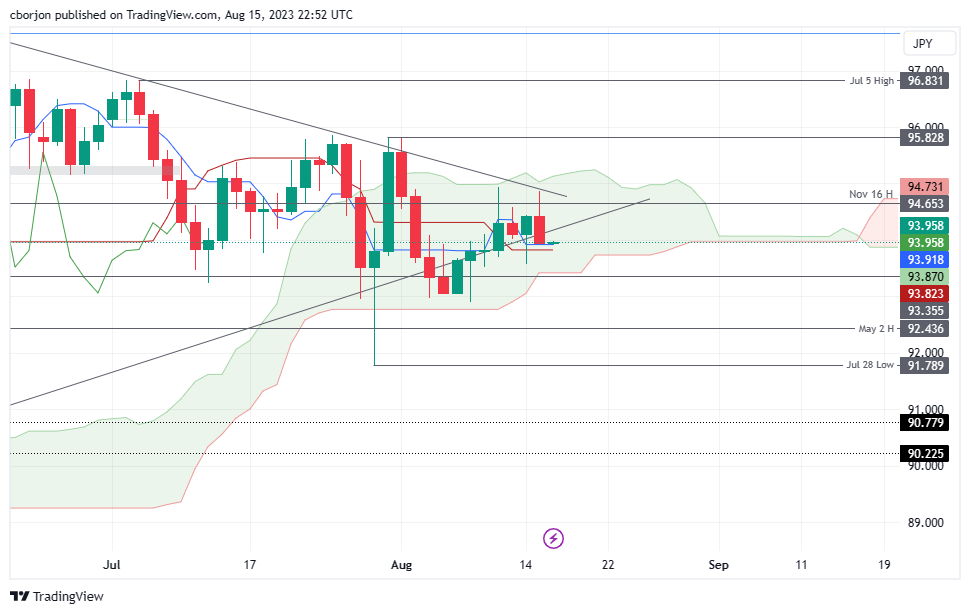
AUD/JPY Daily chart

AUD/JPY

Overview
Today last price93.94
Today Daily Change-0.48
Today Daily Change %-0.51
Today daily open94.42
 
Trends
Daily SMA2094.38
Daily SMA5094.97
Daily SMA10092.61
Daily SMA20091.91
 
Levels
Previous Daily High94.44
Previous Daily Low93.58
Previous Weekly High94.94
Previous Weekly Low92.9
Previous Monthly High96.84
Previous Monthly Low91.79
Daily Fibonacci 38.2%94.11
Daily Fibonacci 61.8%93.91
Daily Pivot Point S193.85
Daily Pivot Point S293.28
Daily Pivot Point S392.98
Daily Pivot Point R194.72
Daily Pivot Point R295.02
Daily Pivot Point R395.59

Author

Christian Borjon Valencia

Markets analyst, news editor, and trading instructor with over 14 years of experience across FX, commodities, US equity indices, and global macro markets.


More from Christian Borjon Valencia
Share:

Editor's Picks

GBP/USD weakens to two-week lows near 1.3520

GBP/USD trades on the back foot, returning to the low 1.3500s, or two-week troughs, on Tuesday. Cable’s bearish price action follows decent gains in the Greenback at the time when investors assess latest US data releases and the persistent uncertainty in the US-Iran crisis.

EUR/USD remains offered; breaks below 1.1600

EUR/USD now accelerates its daily correction, breaching below the key 1.1600 support level on Tuesday. The pair’s daily correction comes on the back of a decent bounce in the US Dollar despite disappointing US data releases and amid persistent geopolitical concerns.

No reaction from Gold; still targets $4,300

Gold extends Monday’s pessimism and slipped back to nearly three-week lows just above the $4,300 mark per troy ounce on Tuesday. The US Dollar’s rebound couple with rising US Treasury yields weigh on the precious metal despite tensions in the Middle East appear far from abated.

Crypto Today: Bitcoin, Ethereum, XRP struggle to extend gains despite ETF inflows

Bitcoin stalls while holding above $78,000 support as ETF inflows return. Ethereum takes a breather around $2,450 amid sustained institutional support. XRP remains pressured as the 200-day EMA provides immediate support.

Global bond market sell off haunts markets

Global sovereign bonds are selling off as we start a new month. The UK is, unsurprisingly, taking the biggest hit. Two and 10-year yields rose by 10 basis points at one point on Tuesday, and are currently higher by 7 and 8bps respectively.

Diesel’s record $100 warning: The oil shock hiding in plain sight

The Oil market may look calmer than it did a few months ago, but diesel is sending a very different message. The US diesel crack spread, the premium of ultra-low sulphur diesel futures over WTI, recently surged above $100 per barrel for the first time, reaching an intraday record of just over $102.00.














