|

AUD/JPY Price Analysis: Registers modest losses, but remains upward biased as hammer emerges

  • AUD/JPY falls to four-day low at 96.58, rebounds slightly amid weak risk appetite and Wall Street losses.
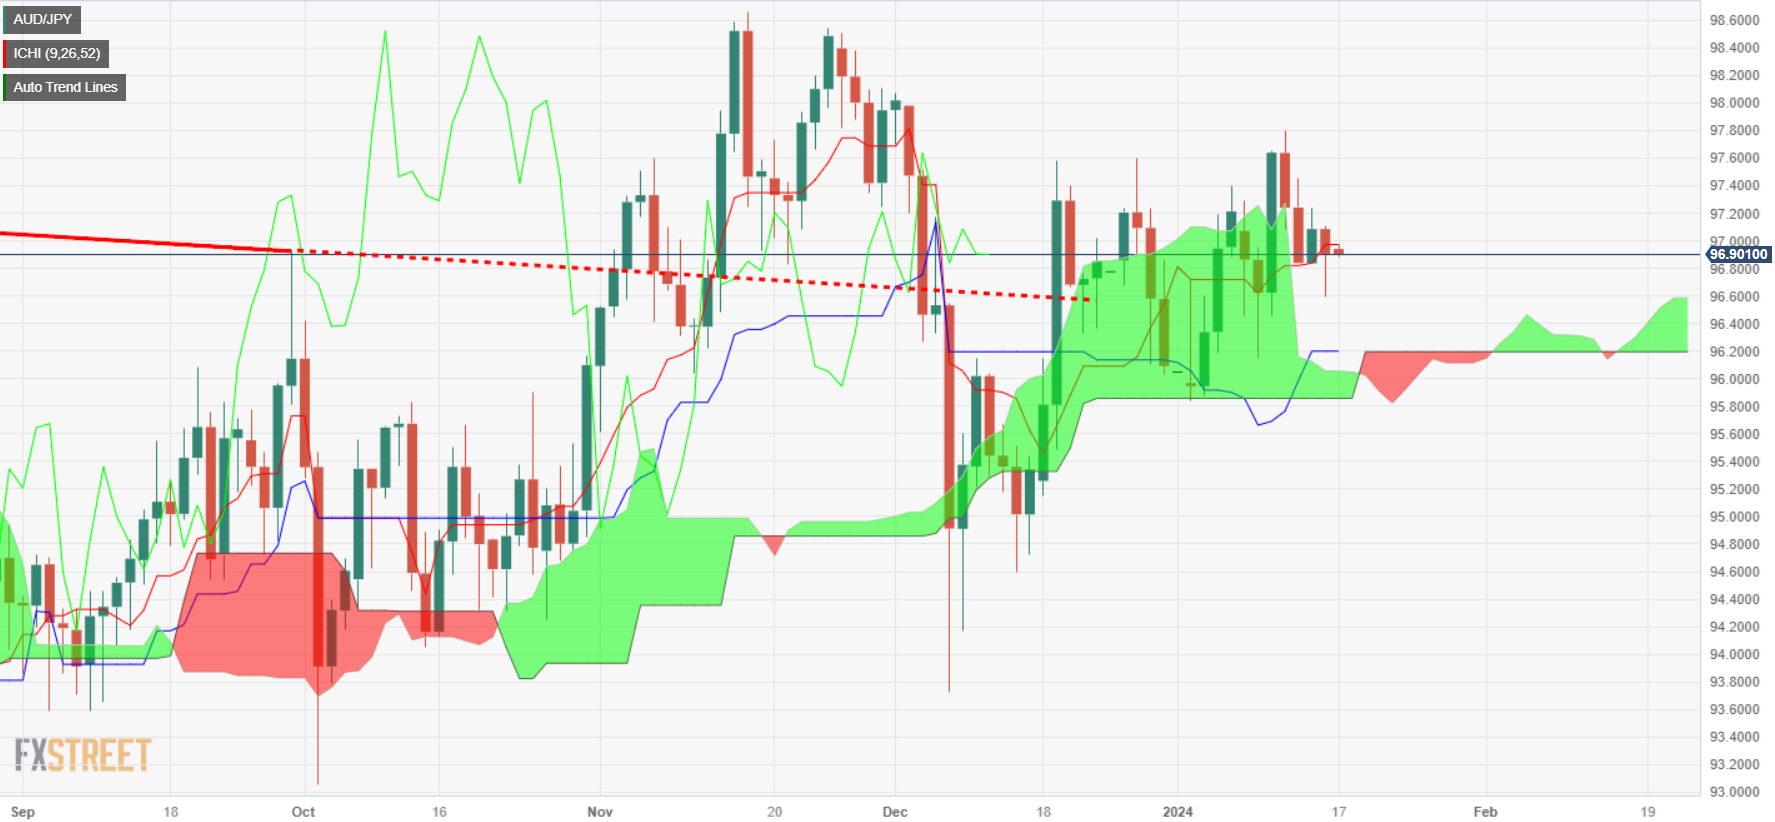
  • Technical analysis: AUD/JPY has an upward bias but faces resistance near 97.00/10; breach could lead to more gains.
  • Sellers target below 97.00, eyeing Senkou Span A and January 16's 96.58 low, with further downside to 96.00.

The AUD/JPY printed modest losses on Tuesday, as risk appetite took its toll as worldwide central bank policymakers pushed back against rate cut expectations. Therefore, Wall Street ended the session with losses, while risk-perceived currencies, like the Aussie Dollar (USD) and the New Zealand Dollar (NZD), registered losses vs. safe-haven peers. The pair is trading at 96.89 as Wednesday’s Asian session begins.

The daily chart suggests the pair is biased upward, though refreshed at a four-day low at 96.58 before paring its earlier losses. That formed a hammer, which usually is a bullish signal, though AUD/JPY is facing stir resistance at a two-month-old downslope resistance trendline that passes at around 97.00/10, which, once cleared, could pave the way for further upside.

In the outcome of reclaiming that level, buyers' next stop would be the January 11 high at 97.79, followed by the 98.00 figure. A breach of the latter will expose last year’s high at 98.58.

Conversely, if sellers keep prices below the 97.00 threshold and drag the spot price toward the confluence of the Senkou Span A and January 16 lows of 96.58, they could remain hopeful of aiming toward the 96.00 figure. Though on its way toward that level, they must conquer the Kijun-Sen and the Senkou Span B convergence at around 96.18/14.

AUD/JPY Price Action – Daily Chart

AUD/JPY Technical Levels

AUD/JPY

Overview
Today last price96.91
Today Daily Change-0.17
Today Daily Change %-0.18
Today daily open97.08
 
Trends
Daily SMA2096.8
Daily SMA5096.85
Daily SMA10095.97
Daily SMA20094.55
 
Levels
Previous Daily High97.24
Previous Daily Low96.84
Previous Weekly High97.8
Previous Weekly Low96.15
Previous Monthly High98.07
Previous Monthly Low93.73
Daily Fibonacci 38.2%97.09
Daily Fibonacci 61.8%96.99
Daily Pivot Point S196.87
Daily Pivot Point S296.65
Daily Pivot Point S396.46
Daily Pivot Point R197.27
Daily Pivot Point R297.46
Daily Pivot Point R397.67

Author

Christian Borjon Valencia

Markets analyst, news editor, and trading instructor with over 14 years of experience across FX, commodities, US equity indices, and global macro markets.

More from Christian Borjon Valencia
Share:

Editor's Picks

EUR/USD remains bid near 1.1650 post-US ADP

Finally some respite for the risk complex see EUR/USD partially recover from the recent steep sell-off, this time hovering around the 1.1650 zone amid decent gains in a context of renewed selling pressure on the US Dollar. However, the duration and extension of this bounce should be put to the test amid the unabated tensions in the Middle East.

GBP/USD meets resistance around 1.3400

In line with its risk-linked peers, GBP/USD stages a modest comeback on Wednesday, although meeting some resistance around the 1.3400 neighbourhood. Cable’s humble recovery comes on the back of the fresh downward bias in the Greenback amid a marginal improvement in the global sentiment and steady geopolitical effervescence.

Gold flirts with $5,200 amid safe haven demand

Gold partially fades Tuesday’s sharp pullback, regaining the $5,200 mark per troy ounce on the back of the resurgence of investors’ demand for the safe-haven space. The precious metal remains well propped up by the deterioration of the geopolitical scenario in the Middle East, while the softer tone in the US Dollar collaborates with the uptick.

Crypto Today: Bitcoin, Ethereum, XRP rebound amid mixed ETF flows

The cryptocurrency market is showing subtle recovery signs despite heightened global uncertainty following the United States (US) and Israel attacks on Iran and the subsequent retaliations that have morphed into a wider Middle East war.

Asian stocks fall as South Korea’s KOSPI slumps over 10%

Asian equities drop on Middle East tensions; the MSCI Asia Pacific Index falls up to 4%. South Korea’s KOSPI fell 10.71% near 5,170, with the Korean Won weakened past 1,500 per dollar.

Solana Price Forecast: SOL consolidation near resistance as ETF inflows offer mild support

Solana price is facing slight rejection as it approaches the upper boundary of the consolidation range at around $88 on Wednesday. Institutional demand is strengthening as spot Exchange Traded Funds recorded two consecutive inflows so far this week.