|

AUD/JPY Price Analysis: Hovers around 93.80-94.40 area, trendless despite the upbeat mood

  • AUD/JPY has been seesawing within a 60-pip trading range for the last couple of days.
  • The AUD/JPY daily chart is neutral, while the hourly time-frame further cements the case for consolidation.

The AUD/JPY finished Wednesday’s session almost flat, forming a quasi dragonfly-doji, meaning that neither buyers/sellers dominated the trading session amidst a risk-on impulse. Factors like lower-than-expected US inflation and tempering tensions between China-Taiwan improved risk appetite. At the time of writing, the AUD/JPY is trading at 94.05, down 0.02%, as the Asian session begins.

AUD/JPY Price Analysis: Technical outlook

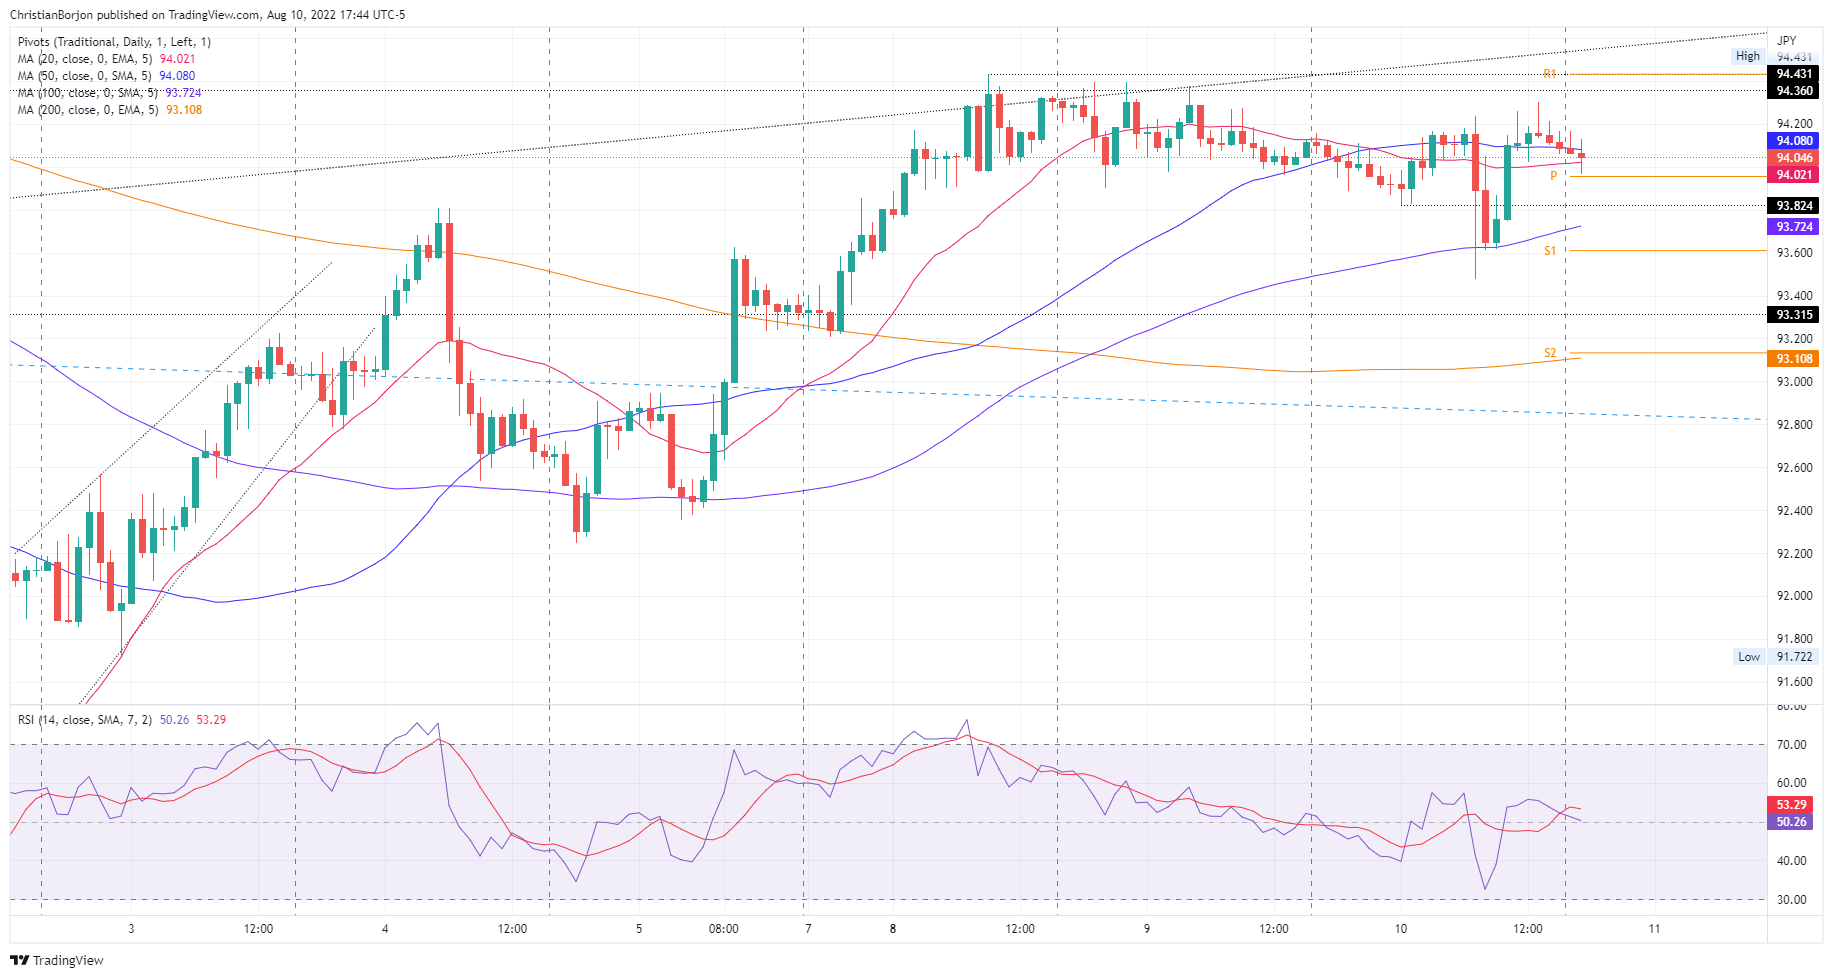
The AUD/JPY daily char chart illustrates the pair as neutral bias, with the 20 and 50-day EMAs meandering around the exchange rate, a reason to think that consolidation lies ahead. Further confirming the aforementioned, Wednesday’s price action printing a dragonfly-doji, indecision amongst AUD/JPY traders.

Switching towards a short-term picture, the AUD/JPY has been seesawing for the last couple of days, within the 93.80-94.40 area, with some candles breaching the aforementioned levels. Still, the price has returned to its “mean reversion” area.

Upwards, the AUD/JPY’s first resistance would be the August 10 high at 94.30. Once cleared, the next supply zone will be the weekly high at 94.43, followed by the psychologically 95.00 area. On the other hand, the AUD/JPY first support will be the 94.00 area. A breach of the latter will send the cross towards the 100-hour EMA at 93.72 (tested on August 10), followed by the August 10 daily low at 93.47.

AUD/JPY Hourly chart

AUD/JPY Key Technical Levels

AUD/JPY

Overview
Today last price94.08
Today Daily Change0.04
Today Daily Change %0.04
Today daily open94.04
 
Trends
Daily SMA2093.96
Daily SMA5093.85
Daily SMA10092.87
Daily SMA20087.9
 
Levels
Previous Daily High94.4
Previous Daily Low93.9
Previous Weekly High93.81
Previous Weekly Low90.52
Previous Monthly High95.76
Previous Monthly Low91.42
Daily Fibonacci 38.2%94.09
Daily Fibonacci 61.8%94.21
Daily Pivot Point S193.83
Daily Pivot Point S293.62
Daily Pivot Point S393.33
Daily Pivot Point R194.32
Daily Pivot Point R294.61
Daily Pivot Point R394.82

Author

Christian Borjon Valencia

Markets analyst, news editor, and trading instructor with over 14 years of experience across FX, commodities, US equity indices, and global macro markets.

More from Christian Borjon Valencia
Share:

Editor's Picks

EUR/USD seems fragile below 1.1700 as Middle East war boosts energy prices

The EUR/USD pair trades flat at around 1.1680 during the Asian trading session on Tuesday, but broadly seems vulnerable, being close to its five-week low. The major currency pair is under pressure as surging oil prices due to the United States-Israel war with Iran have increased the risks of higher inflation for the Old Continent.

GBP/USD hovers around 1.3400 with bearish pressure intact

GBP/USD edges higher after three days of losses, trading around 1.3400 during the Asian hours on Tuesday. The technical analysis of the daily chart indicates an ongoing bearish bias, as the pair trades within a descending channel pattern.

Gold sticks to gains above $5,350 amid sustained safe-haven demand; firmer USD caps gains

Gold sticks to its positive bias for the third straight day and trades above the $5,350 level heading into the European session on Tuesday. Concerns about a broader regional conflict in the Middle East continue to weigh on investors' sentiment and underpin demand for the traditional safe-haven bullion.

Stellar risks deeper losses as derivatives metrics turn negative

Stellar is trading red below $0.16 at the time of writing on Tuesday, after a slight recovery the previous day. Weakening derivatives data caps the recovery, while an unfavorable technical outlook projects a deeper correction for the XLM token in the upcoming days.

The market is not panicking it is repricing the probability distribution of Oil and time

At the end of the day, markets do not trade morality or geopolitics. They trade transmission channels. And the only channel that truly matters in this maelstrom runs through the price of energy and the time value of money.

Grass 20% bullish breakout defies broader market weakness

Grass (GRASS) is edging up above $0.30 at the time of writing on Monday. The token’s notable 20% intraday surge stands out amid heightened volatility in the broader crypto market.