|

AUD/JPY Price Analysis: Holds to gains post RBA as technicals support further upside

  • AUD/JPY sees a sharp rally, buoyed by RBA’s surprise rate hike to 4.10%; the pair trades flat above 93.00.
  • The technical analysis projects a bullish bias, with key resistance at the December 19 high of 93.35.
  • Risk aversion could trigger pullback, with initial support found at the May 19 high of 92.35.

AUD/JPY rallied sharply on Tuesday after the Reserve Bank of Australia (RBA) surprisingly raised rates by 25 bps, lifting the cash rate to 4.10%. Therefore, the AUD/JPY jumped from 92.30, toward 93.14, before retracing some of those gains, but buyers moving in, lifted the AUD/JPY toward the current spot price. At the time of writing, the AUD/JPY is trading at 93.14, flat as the Asian session begins.

AUD/JPY Price Analysis: Technical outlook

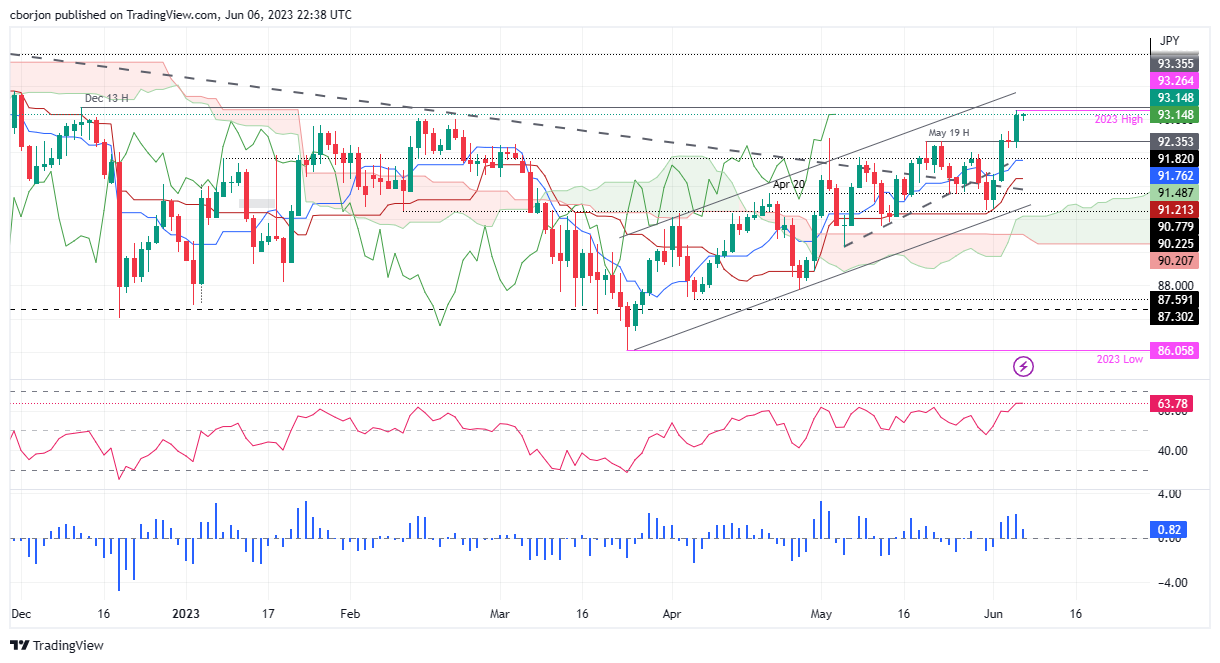
After rallying sharply, the AUD/JPY remains upward biased, as it sits above the Ichimoku Cloud and the Chikou Span. Additionally, the Tenkan-Sen line is above the Kijun-Sen line, each at 91.76 and 91.21, respectively, another bullish signal. Nevertheless, the nature of the cross-currency pair indicates that its subject-to-market sentiment swings, which could shift the pair’s direction.

The Relative Strength Index (RSI) indicator and the 3-day Rate of Change (RoC) further cement the bias, as the RSI sits in bullish territory, while the RoC indicates buyers remain in charge.

Therefore, the AUD/JPY first resistance would be the December 19 high at 93.35. A breach of the latter will expose a top-trendline of an ascending channel at around 93.70/85 before challenging the 94.00 figure.

In the event of risk aversion, the AUD/JPY pair may be subject to a pullback, and the first support would be the May 19 high at 92.35 before diving to the 92.00 figure. Once cleared, the next support would be the Tenkan-Sen line at 91.76, ahead of sliding toward the Kijun-Sen line at 91.21.

AUD/JPY Price Action – Daily chart

AUD/JPY Daily chart

AUD/JPY

Overview
Today last price93.12
Today Daily Change0.75
Today Daily Change %0.81
Today daily open92.37
 
Trends
Daily SMA2091.37
Daily SMA5090.25
Daily SMA10090.48
Daily SMA20091.82
 
Levels
Previous Daily High92.66
Previous Daily Low92.14
Previous Weekly High92.56
Previous Weekly Low90.26
Previous Monthly High92.44
Previous Monthly Low89.16
Daily Fibonacci 38.2%92.34
Daily Fibonacci 61.8%92.46
Daily Pivot Point S192.12
Daily Pivot Point S291.86
Daily Pivot Point S391.59
Daily Pivot Point R192.64
Daily Pivot Point R292.91
Daily Pivot Point R393.17

Author

Christian Borjon Valencia

Christian Borjon began his career as a retail trader in 2010, mainly focused on technical analysis and strategies around it. He started as a swing trader, as he used to work in another industry unrelated to the financial markets.

More from Christian Borjon Valencia
Share:

Markets move fast. We move first.

Orange Juice Newsletter brings you expert driven insights - not headlines. Every day on your inbox.

By subscribing you agree to our Terms and conditions.

Editor's Picks

EUR/USD moves sideways below 1.1800 on Christmas Eve

EUR/USD struggles to find direction and trades in a narrow channel below 1.1800 after posting gains for two consecutive days. Bond and stock markets in the US will open at the usual time and close early on Christmas Eve, allowing the trading action to remain subdued. 

GBP/USD keeps range around 1.3500 amid quiet markets

GBP/USD keeps its range trade intact at around 1.3500 on Wednesday. The Pound Sterling holds the upper hand over the US Dollar amid pre-Christmas light trading as traders move to the sidelines heading into the holiday season. 

Gold retreats from record highs, trades below $4,500

Gold retreats after setting a new record-high above $4,520 earlier in the day and trades in a tight range below $4,500 as trading volumes thin out ahead of the Christmas break. The US Dollar selling bias remains unabated on the back of dovish Fed expectations, which continues to act as a tailwind for the bullion amid persistent geopolitical risks.

Bitcoin slips below $87,000 as ETF outflows intensify, whale participation declines

Bitcoin price continues to trade around $86,770 on Wednesday, after failing to break above the $90,000 resistance. US-listed spot ETFs record an outflow of $188.64 million on Tuesday, marking the fourth consecutive day of withdrawals.

Economic outlook 2026-2027 in advanced countries: Solidity test

After a year marked by global economic resilience and ending on a note of optimism, 2026 looks promising and could be a year of solid economic performance. In our baseline scenario, we expect most of the supportive factors at work in 2025 to continue to play a role in 2026.

Avalanche struggles near $12 as Grayscale files updated form for ETF

Avalanche trades close to $12 by press time on Wednesday, extending the nearly 2% drop from the previous day. Grayscale filed an updated form to convert its Avalanche-focused Trust into an ETF with the US Securities and Exchange Commission.