AUD/JPY Price Analysis: Dribbles inside a triangle above 77.00
- AUD/JPY keeps a 30-pip trading range above 200-HMA.
- RSI, MACD signal continuation of sideways trading, triangle pattern backs the indicators.

AUD/JPY ticks up to 77.21 during the early Wednesday morning in Asia. Even so, the quote stays inside the 77.07-37 trading range while keeping a one-week-old triangle formation intact.
Although symmetrical triangle and normal RSI joins unclear MACD signals to hint at the extension of the present lack of momentum, a sustained trading above 200-HMA keeps the AUD/JPY buyers hopeful.
However, a clear break above 77.37 will need to cross the stated triangle’s resistance line, at 77.45 now, to challenge the monthly high of 77.56 while eyeing September 10 top near 77.80.
Meanwhile, 200-HMA and the triangle support, respectively around 77.06 and 77.00, restrict the pair’s short-term downside.
In a case where the AUD/JPY sellers sneak in below 77.00, odds of witnessing 76.45, November 25 low, can’t be ruled out.
AUD/JPY hourly chart
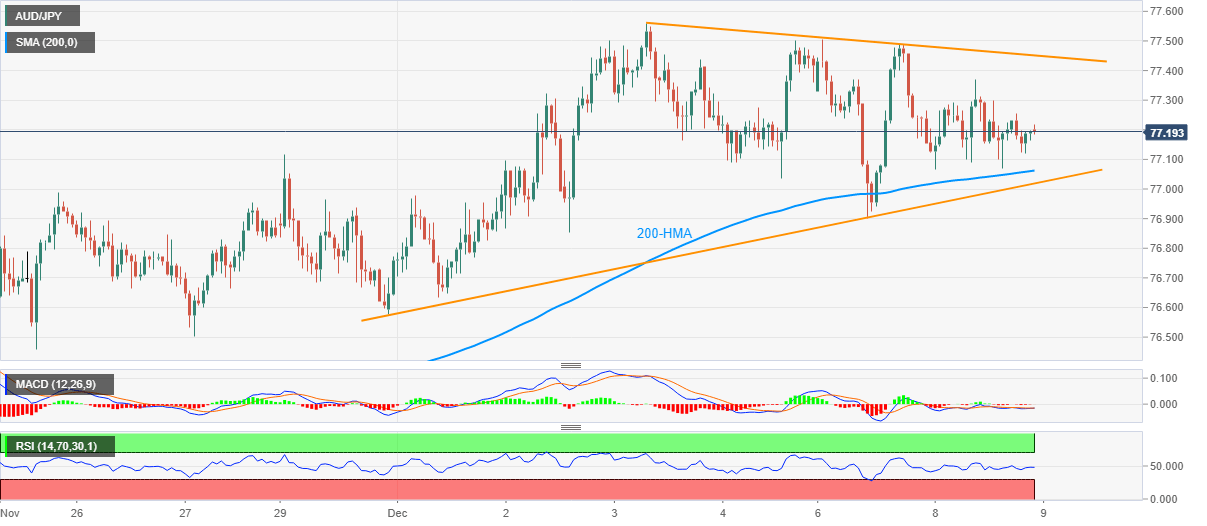
Trend: Sideways
Author

Anil Panchal
FXStreet
Anil Panchal has nearly 15 years of experience in tracking financial markets. With a keen interest in macroeconomics, Anil aptly tracks global news/updates and stays well-informed about the global financial moves and their implications.


