|

AUD/JPY Price Analysis: Climbs for 6-straight days on risk-on mood, RBA’s last week’s hike

  • AUD/JPY nears weekly high at 94.22, gaining for the sixth consecutive day.
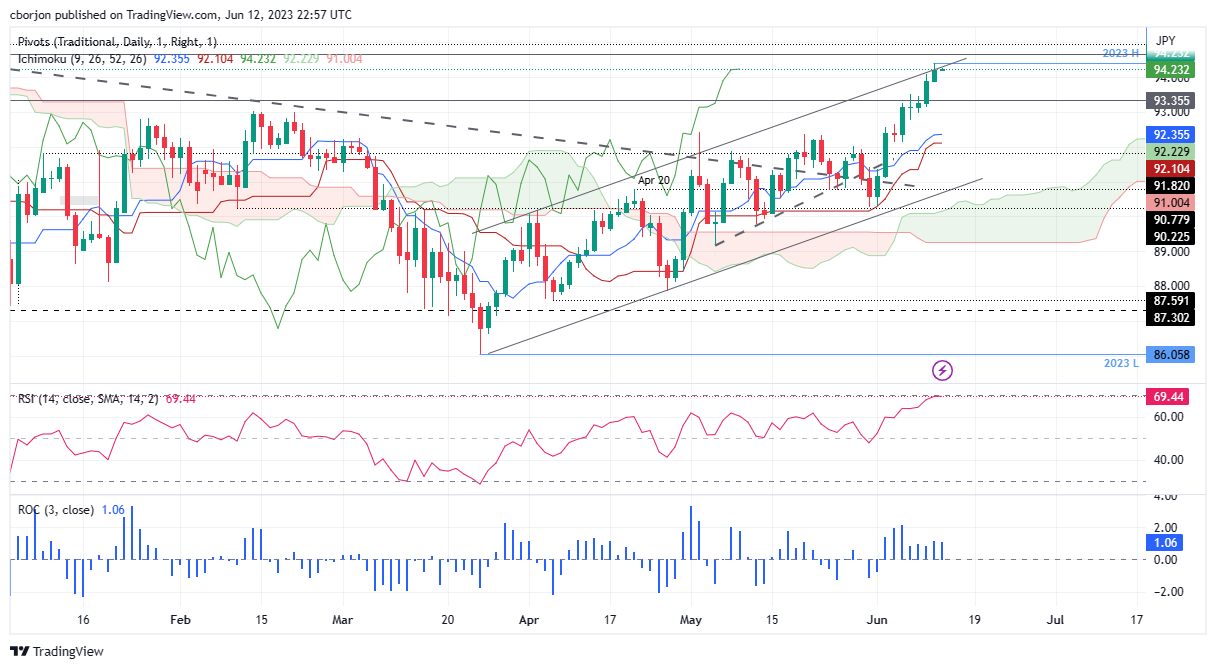
  • The pair shows upward bias, but RSI and three-day RoC indicators suggest a potential retreat.
  • Following support for AUD/JPY lies at a June 12 low of 93.84, followed by the 93.00 mark.

AUD/JPY stays on track toward its six straight days of gains as the Asian session begins. A risk-on impulse underpins the Australian Dollar (AUD), which is still gaining momentum after last week’s rate hike by the Reserve Bank of Australia (RBA). At the time of writing, the AUD/JPY trades at 94.22, nearby the weekly high of 94.41, with minuscule gains of 0.02%.

AUD/JPY Price Analysis: Technical outlook

The AUD/JPY daily chart portrays the pair as upward biased, at the brisk of breaking the November 16 high at 94.65, which could open the door for further upside. That would clear the path toward a new year-to-date (YTD) high and propel the Aussie towards challenging resistance at around the 95.00 psychological price level.

Even though the Ichimoku cloud supports the uptrend thesis, the Relative Strength Index (RSI) indicator signals the pair is overbought, warranting a pullback is expected. Another factor suggests the pair could retrace the three-day Rate of Change (RoC), showing that buying pressure is easing.

If AUD/JPY drops below 94.00, the following support to be tested would be the June 12 low of 93.84. Once cleared, the AUD/JPY next stop would be December’s 13 high turned support at 93.35 before testing the psychological 93.00 mark.

AUD/JPY Price Action – Daily chart

AUD/JPY Daily chart

AUD/JPY

Overview
Today last price94.22
Today Daily Change0.24
Today Daily Change %0.26
Today daily open93.98
 
Trends
Daily SMA2091.92
Daily SMA5090.63
Daily SMA10090.64
Daily SMA20091.78
 
Levels
Previous Daily High94.1
Previous Daily Low93.16
Previous Weekly High94.1
Previous Weekly Low92.14
Previous Monthly High92.44
Previous Monthly Low89.16
Daily Fibonacci 38.2%93.74
Daily Fibonacci 61.8%93.52
Daily Pivot Point S193.4
Daily Pivot Point S292.82
Daily Pivot Point S392.47
Daily Pivot Point R194.33
Daily Pivot Point R294.68
Daily Pivot Point R395.26

Author

Christian Borjon Valencia

Markets analyst, news editor, and trading instructor with over 14 years of experience across FX, commodities, US equity indices, and global macro markets.

More from Christian Borjon Valencia
Share:

Editor's Picks

EUR/USD struggles aroound 1.1800 as USD stabilizes

EUR/USD stays defensive around 1.1800 in the European session on Thursday. The US Dollar stabilizes, following the recent decline led by tariff uncertainty, capping the pair's upside. All eyes now remain on the US-Iran nuclear talks after ECB President Lagarde's testimony fails to impress Euro bulls. 

GBP/USD drops toward 1.3500 as USD finds fresh demand

GBP/USD falls back toward 1.3500 in the European session on Thursday, snapping its recovery momentum. The pair loses traction as the US Dollar finds fresh demand, as markets turn cautious ahead of the US-Iran nuclear talks. The US trade policy uncertainty also remains a drag on risk sentiment. 

Gold clings to gains amid sustained safe-haven flows ahead of US-Iran talks

Gold sticks to its modest intraday gains through the first half of the European session on Thursday, with bulls still awaiting a sustained move and acceptance above the $5,200 mark before placing fresh bets. 

Stellar: Relief bounce fades as bearish undertone persists

Stellar is trading around $0.16 at the time of writing on Thursday after rebounding more than 8% in the previous day. Derivatives data paints a negative picture as XLM’s short bets hit a monthly high while Open Interest continues to decline.

The one thing everyone is on the lookout for is US action of some sort against Iran

The FX market is minestrone soup these days. It is befuddled by conflicting data, rumors and small stories exaggerated out of proportion, and Trump-generated uncertainty. 

Solana strikes key resistance with double-digit gains

Solana trades at $88 at press time on Thursday, after an 11% upswing the previous day within a broader consolidation range of roughly three weeks. Institutional demand for Solana heightens as US spot SOL Exchange Traded Funds record $30 million of inflow on Wednesday.