|

AUD/JPY Price Analysis: Climbs above 97.00 amid risk aversion

  • AUD/JPY's gains defy typical risk aversion impact, supported by fading expectations of BoJ policy normalization.
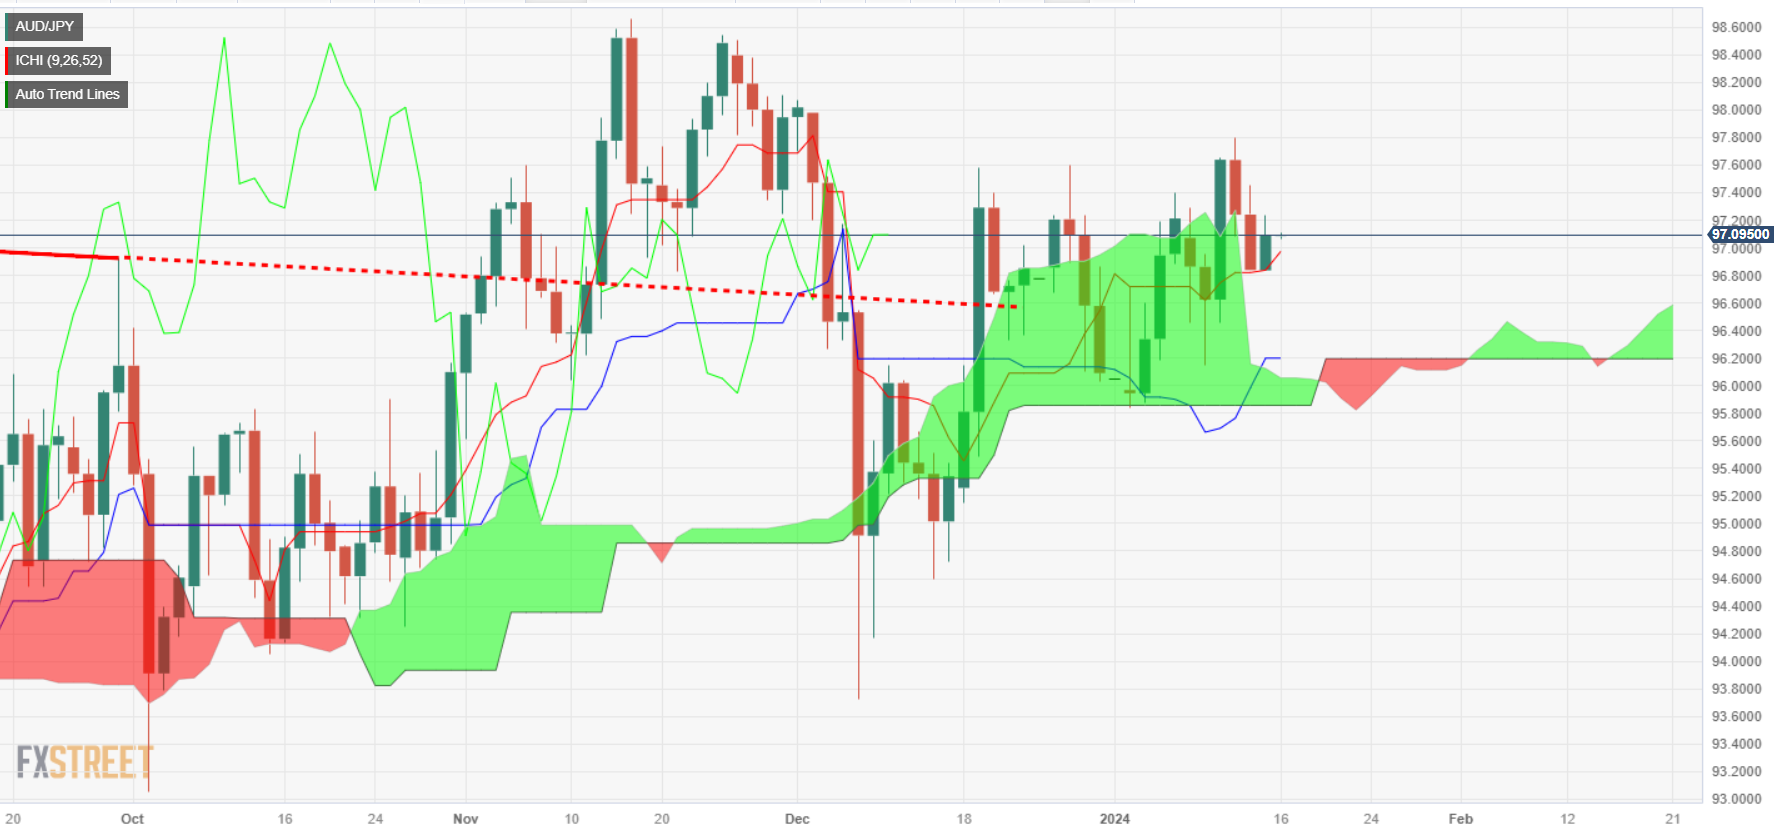
  • Technical indicators signal bullish trend; immediate targets include 97.79, 98.00, and November 30 high at 98.10.
  • Downside risks for AUD/JPY include potential supports at 96.41 (Senkou Span A), 96.14 (Senkou Span B), and the 96.00 level.

The Aussie Dollar (AUD) prints gains versus the Japanese Yen (JPY) on Monday amid a risk aversion environment, which usually is a headwind for the AUD/JPY pair. Nevertheless, Japanese data revealed during January has brushed away the chances for the Bank of Japan (BoJ) to normalize policy, meaning higher interest rates. Therefore, the AUD/JPY trades at 97.08, gains 0.27%.

From a technical perspective, the AUD/JPY turned bullish as the Chikou Span has broken above price action in the daily chart. That, alongside the exchange rate seen above, the Ichimoku Cloud (Kumo), has opened the door for further gains, though traders must regain key resistance levels on their way north.

The first supply zone would be the January 11 high of 97.79, followed by the 98.00 figure, and the November 30 mark 1t 98.10. Further upside is at 98.58, the November 15 high.

On the other hand, if sellers would like to drag prices below 97.00. Once cleared, the next support would be the Senkou Span A at 96.41, followed by the Senkow Span B at 96.14, followed by the 96.00 figure.

AUD/JPY Price Action – Daily Chart

AUD/JPY Key Technical Levels

AUD/JPY

Overview
Today last price97.1
Today Daily Change0.26
Today Daily Change %0.27
Today daily open96.84
 
Trends
Daily SMA2096.74
Daily SMA5096.86
Daily SMA10095.94
Daily SMA20094.51
 
Levels
Previous Daily High97.45
Previous Daily Low96.84
Previous Weekly High97.8
Previous Weekly Low96.15
Previous Monthly High98.07
Previous Monthly Low93.73
Daily Fibonacci 38.2%97.07
Daily Fibonacci 61.8%97.22
Daily Pivot Point S196.64
Daily Pivot Point S296.43
Daily Pivot Point S396.02
Daily Pivot Point R197.25
Daily Pivot Point R297.66
Daily Pivot Point R397.86

Author

Christian Borjon Valencia

Markets analyst, news editor, and trading instructor with over 14 years of experience across FX, commodities, US equity indices, and global macro markets.

More from Christian Borjon Valencia
Share:

Editor's Picks

EUR/USD climbs to daily highs on US CPI

EUR/USD now accelerates it rebound and flirts with the 1.1880 zone on Friday, or daily highs, all in response to renewed selling pressure on the US Dollar. In the meantime, US inflation figures showed the headline CPI rose less than expected in January, removing some tailwinds from the Greenback’s momentum.

GBP/USD clings to gains above 1.3600

GBP/USD reverses three consecutive daily pullbacks on Friday, hovering around the low-1.3600s on the back of the vacillating performance of the Greenback in the wake of the release of US CPI prints in January. Earlier in the day, the BoE’s Pill suggested that UK inflation could settle around 2.5%, above the bank’s goal.

Gold: Upside remains capped by $5,000

Gold is reclaiming part of the ground lost on Wednesday’s marked retracement, as bargain-hunters seem to have stepped in. The precious metal’s upside, however, appears limited amid the slightly better tone in the US Dollar after US inflation data saw the CPI rise less than estimated at the beginning of the year.

Crypto Today: Bitcoin, Ethereum, XRP in choppy price action, weighed down by falling institutional interest 

Bitcoin's upside remains largely constrained amid weak technicals and declining institutional interest. Ethereum trades sideways above $1,900 support with the upside capped below $2,000 amid ETF outflows.

The weekender: When software turns the blade on itself

Autonomous AI does not just threaten trucking companies and call centers. It challenges the cognitive toll booths that legacy software has charged for decades. This is not a forecast. No one truly knows the end state of AI.

Solana Price Forecast: Mixed market sentiment caps recovery

Solana (SOL) is trading at $79 as of Friday, following a correction of over 9% so far this week. On-chain and derivatives data indicates mixed sentiment among traders, further limiting the chances of a price recovery.