AUD/JPY Price Analysis: China-inspired optimism defends buyers past 95.00 key support


Share:
  • AUD/JPY pushes back bearish bias after snapping two-day winning streak the previous day.
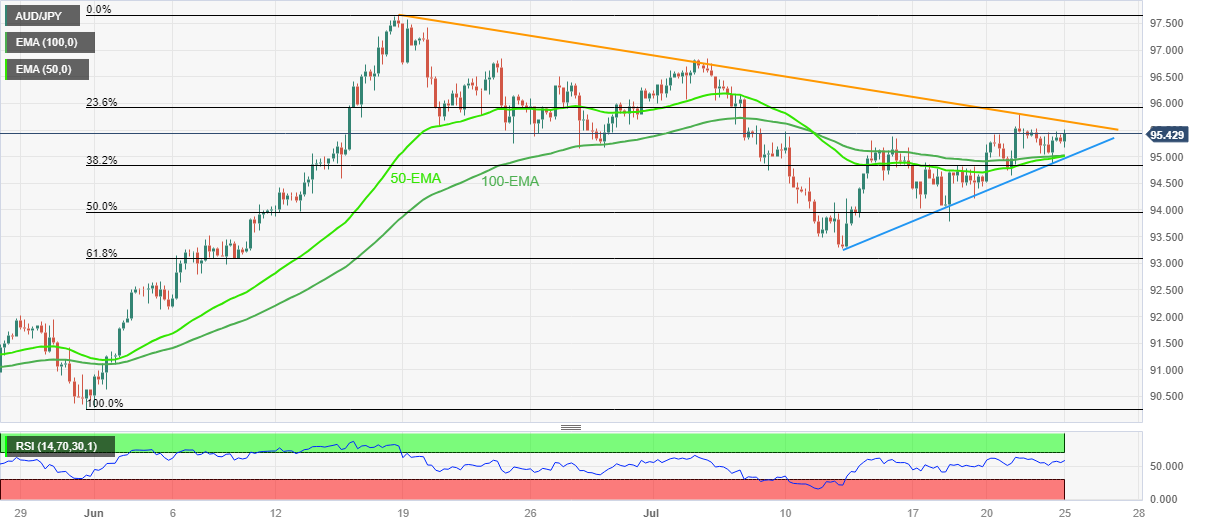
  • Convergence of key EMA, two-week-old rising support line appears a tough nut to crack for sellers.
  • China policymakers pledge more stimulus to defend the dragon nation, PBoC keeps Yuan afloat.

AUD/JPY clings to mild gains above 95.00 as it cheers China-linked risk-on mood during early Tuesday. In doing so, the cross-currency pair defends the previous day’s rebound from a convergence of the 50 and 100 Exponential Moving Average (EMA), as well as a two-week-long rising trend line.

Also read: USD/CNH slides to 7.1500 as PBoC defends Yuan, China stimulus loom

Apart from that, the upbeat RSI (14) line, not overbought, also underpins bullish bias about the AUD/JPY pair.

However, a downward-sloping resistance line from June 18, close to 95.70 at the latest, seems a strong hurdle for the bulls to cross for conviction.

Following that, the monthly high surrounding 96.85 and the yearly peak marked in June surrounding 97.70 will be in the spotlight.

In a case where the AUD/JPY remains firmer past 97.70, the previous yearly top of around 98.60 and the 100.00 psychological magnet could lure the bulls.

Meanwhile, a downside break of the 95.00 support confluence comprising the aforementioned key EMAs and the trend line could drag the quote toward the 50% Fibonacci retracement of the May-June upside, close to 93.95.

However, the monthly low and the 61.8% Fibonacci retracement, respectively near 93.30 and 93.10, adjacent to the 93.00 round figure, will test the AUD/JPY bears afterward.

AUD/JPY: Four-hour chart

Trend: Further upside expected

Additional important levels

Overview
Today last price 95.38
Today Daily Change 0.04
Today Daily Change % 0.04%
Today daily open 95.34
 
Trends
Daily SMA20 95.27
Daily SMA50 94.18
Daily SMA100 91.78
Daily SMA200 91.93
 
Levels
Previous Daily High 95.53
Previous Daily Low 94.88
Previous Weekly High 95.79
Previous Weekly Low 93.78
Previous Monthly High 97.68
Previous Monthly Low 90.3
Daily Fibonacci 38.2% 95.12
Daily Fibonacci 61.8% 95.28
Daily Pivot Point S1 94.97
Daily Pivot Point S2 94.6
Daily Pivot Point S3 94.32
Daily Pivot Point R1 95.62
Daily Pivot Point R2 95.9
Daily Pivot Point R3 96.28


Share: Feed news

Information on these pages contains forward-looking statements that involve risks and uncertainties. Markets and instruments profiled on this page are for informational purposes only and should not in any way come across as a recommendation to buy or sell in these assets. You should do your own thorough research before making any investment decisions. FXStreet does not in any way guarantee that this information is free from mistakes, errors, or material misstatements. It also does not guarantee that this information is of a timely nature. Investing in Open Markets involves a great deal of risk, including the loss of all or a portion of your investment, as well as emotional distress. All risks, losses and costs associated with investing, including total loss of principal, are your responsibility. The views and opinions expressed in this article are those of the authors and do not necessarily reflect the official policy or position of FXStreet nor its advertisers. The author will not be held responsible for information that is found at the end of links posted on this page.

If not otherwise explicitly mentioned in the body of the article, at the time of writing, the author has no position in any stock mentioned in this article and no business relationship with any company mentioned. The author has not received compensation for writing this article, other than from FXStreet.

FXStreet and the author do not provide personalized recommendations. The author makes no representations as to the accuracy, completeness, or suitability of this information. FXStreet and the author will not be liable for any errors, omissions or any losses, injuries or damages arising from this information and its display or use. Errors and omissions excepted.

The author and FXStreet are not registered investment advisors and nothing in this article is intended to be investment advice.

Follow us on Telegram

Stay updated of all the news

Join Telegram

Recommended content


Follow us on Telegram

Stay updated of all the news

Join Telegram

Recommended content

Editors’ Picks

EUR/USD bounces back, trades above 1.0860

EUR/USD bounces back, trades above 1.0860

EUR/USD bounced from a fresh weekly low of 1.0827, as the US Dollar lost steam following a weak ISM Manufacturing PMI report and words from Federal Reserve Chair Jerome Powell. Powell reiterated its hawkish message, dismissing potential rate cuts in the near future. 

EUR/USD News

GBP/USD turns north ahead of the weekly close, approaches 1.2700

GBP/USD turns north ahead of the weekly close, approaches 1.2700

GBP/USD extended its rebound from near 1.2600 and is approaching 1.2700 on the back of a weaker US Dollar. The Greenback accelerated to the downside following comments from Fed’s Powell. 

GBP/USD News

Gold resumes advance and approaches record highs

Gold resumes advance and approaches record highs

Gold remains near record highs and achieved its highest monthly close ever in November. Global bond yields continue to decline as inflation further cools, supporting the upside in XAU/USD. With central banks expected to remain on hold, the focus will be US labor market data. 

Gold News

Solana likely to extend gains as DeFi airdrop season could boost user base

Solana likely to extend gains as DeFi airdrop season could boost user base

Solana ecosystem will see airdrops from projects like Jupiter, Marginfi, Drift, Zeta and Jito. Solana users are projected to increase between 30% and 80% from native token launches, according to Messari’s latest report.  SOL price extends rally, yielding nearly 4% daily gains. 

Read more

Tesla Stock News: Cybertruck excitement fails to sustain TSLA price as chart signals more downside

Tesla Stock News: Cybertruck excitement fails to sustain TSLA price as chart signals more downside

TSLA stock sinks three days in a row despite Cybertruck unveiling. Analysts conclude that Cybertruck will find it difficult to turn a profit. TSLA stock is the midst of forming a bearish Three Black Crows pattern on the daily chart.

Read more

Forex MAJORS

Cryptocurrencies

Signatures