|

AUD/JPY Price Analysis: Bulls steer the market towards 101.00, its highest since 2014

  • The daily RSI of the AUD/JPY continues its uphill journey, nearing overbought territory, amplifying buying traction.
  • Hourly indicators are also strong, with no signs of bears.
  • A healthy correction shouldn't be ruled out.

The AUD/JPY market showcases an increasingly bullish trend. The cross stabilized at 100.89 on Wednesday, after rallying to a high at 101.12, its highest since 2014. The general market interest leans towards the buyers as the pair follows an upward trend and surpasses significant levels. However, as the pair gained nearly 1.50% in the last sessions, the cross might be poised for a correction.

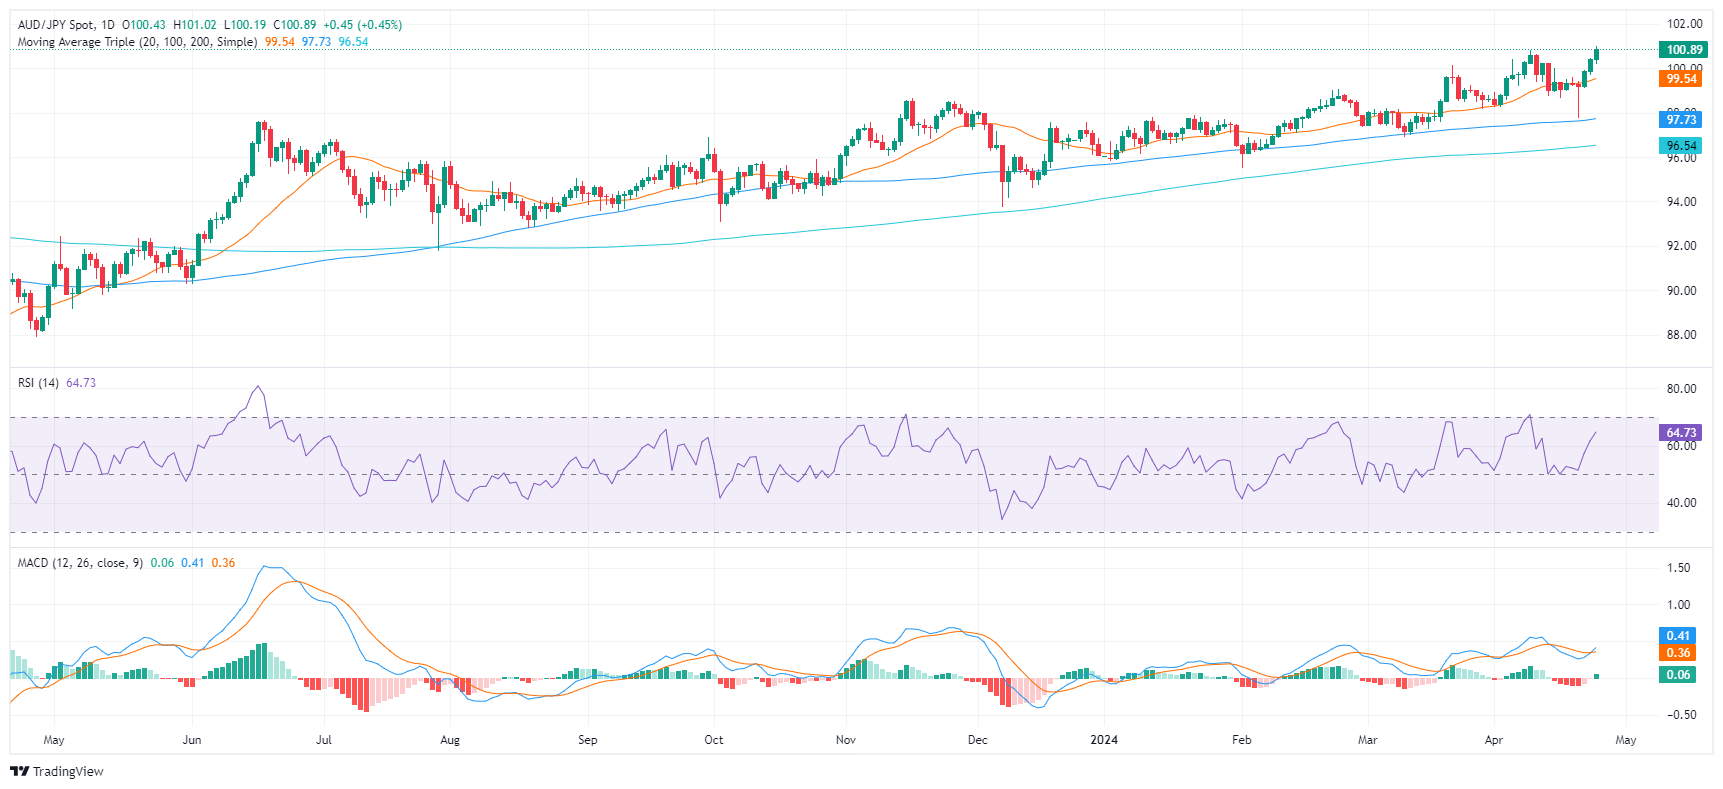
On the daily chart, the Relative Strength Index (RSI) of the AUD/JPY pair continues its upward trajectory nearing overbought territory. The Moving Average Convergence Divergence (MACD) also supports the buyers, as it prints a fresh green bar.

AUD/JPY daily chart

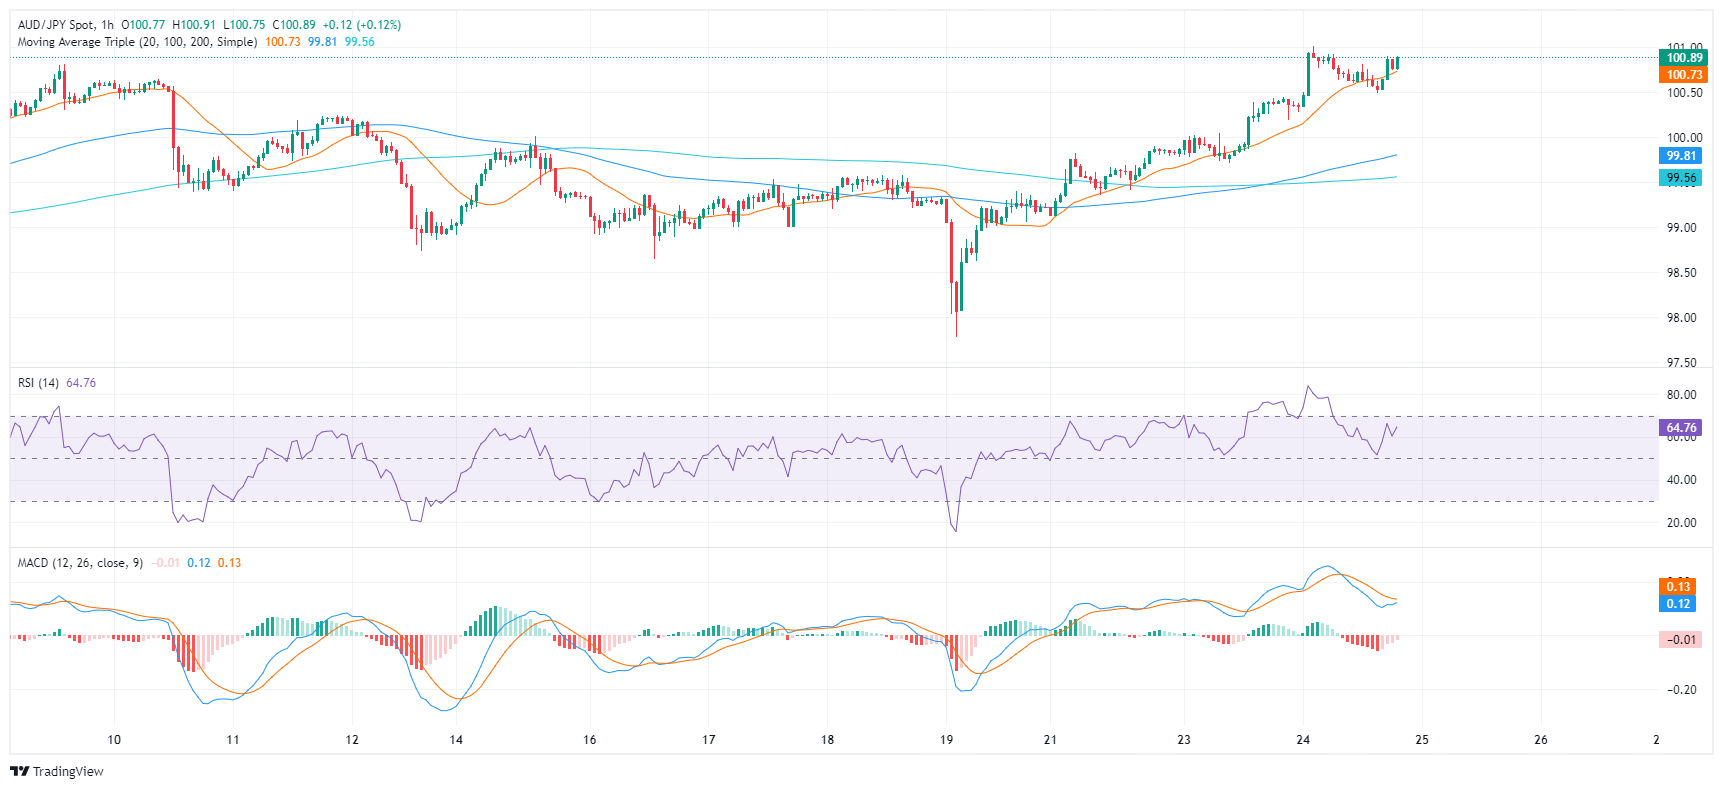
Switching the focus to the hourly chart, the hourly Relative Strength Index (RSI) displays a generally increasing trend, pointing toward positive short-term momentum. In addition, the MACD portrays decreasing red bars, denoting the declining momentum of the sellers in the short-term trading hours.

AUD/JPY hourly chart

In the broader outlook, the AUD/JPY indicates a bullish trend, given its current position above the 20, 100, and 200-day Simple Moving Average (SMA). SMAs serve as technical indicators for analyzing price trends by smoothing out price fluctuations. The pair's stance above all three SMAs suggests a strong stance from the bull in the short and long-term perspectives. In addition, the pair rallying to multi-year highs suggests that the bulls are clearly in command, but traders shouldn't be ruled out as indicators might run out of steam.

AUD/JPY

Overview
Today last price100.89
Today Daily Change0.46
Today Daily Change %0.46
Today daily open100.43
 
Trends
Daily SMA2099.44
Daily SMA5098.69
Daily SMA10097.69
Daily SMA20096.5
 
Levels
Previous Daily High100.45
Previous Daily Low99.71
Previous Weekly High100.02
Previous Weekly Low97.78
Previous Monthly High100.17
Previous Monthly Low96.9
Daily Fibonacci 38.2%100.17
Daily Fibonacci 61.8%99.99
Daily Pivot Point S199.94
Daily Pivot Point S299.46
Daily Pivot Point S399.21
Daily Pivot Point R1100.68
Daily Pivot Point R2100.94
Daily Pivot Point R3101.42

Author

Patricio Martín

Patricio is an economist from Argentina passionate about global finance and understanding the daily movements of the markets.

More from Patricio Martín
Share:

Markets move fast. We move first.

Orange Juice Newsletter brings you expert driven insights - not headlines. Every day on your inbox.

By subscribing you agree to our Terms and conditions.

Editor's Picks

EUR/USD moves sideways below 1.1800 on Christmas Eve

EUR/USD struggles to find direction and trades in a narrow channel below 1.1800 after posting gains for two consecutive days. Bond and stock markets in the US will open at the usual time and close early on Christmas Eve, allowing the trading action to remain subdued. 

GBP/USD keeps range around 1.3500 amid quiet markets

GBP/USD keeps its range trade intact at around 1.3500 on Wednesday. The Pound Sterling holds the upper hand over the US Dollar amid pre-Christmas light trading as traders move to the sidelines heading into the holiday season. 

Gold retreats from record highs, trades below $4,500

Gold retreats after setting a new record-high above $4,520 earlier in the day and trades in a tight range below $4,500 as trading volumes thin out ahead of the Christmas break. The US Dollar selling bias remains unabated on the back of dovish Fed expectations, which continues to act as a tailwind for the bullion amid persistent geopolitical risks.

Bitcoin slips below $87,000 as ETF outflows intensify, whale participation declines

Bitcoin price continues to trade around $86,770 on Wednesday, after failing to break above the $90,000 resistance. US-listed spot ETFs record an outflow of $188.64 million on Tuesday, marking the fourth consecutive day of withdrawals.

Economic outlook 2026-2027 in advanced countries: Solidity test

After a year marked by global economic resilience and ending on a note of optimism, 2026 looks promising and could be a year of solid economic performance. In our baseline scenario, we expect most of the supportive factors at work in 2025 to continue to play a role in 2026.

Avalanche struggles near $12 as Grayscale files updated form for ETF

Avalanche trades close to $12 by press time on Wednesday, extending the nearly 2% drop from the previous day. Grayscale filed an updated form to convert its Avalanche-focused Trust into an ETF with the US Securities and Exchange Commission.