|

AUD/JPY Price Analysis: Bearish pressure intensifies, potential short-term rebound signalled

  • The hourly chart portrays the RSI in the oversold territory, signaling a potential short-term rebound.
  • On a broader perspective, the AUD/JPY remains above the main SMAs, indicating long-term bullish sentiment.
  • The daily RSI is also in negative territory, showing increasing selling pressure.
  • In the next sessions, the sellers may take a step back to consolidate their movements.

In Friday's session, the AUD/JPY pair is now trading at 97.49, demonstrating a loss of 0.38%. While the pair is currently dominated by sellers, oversold conditions seen on the hourly chart suggest that the pair may see some upside in the short term to consolidate.

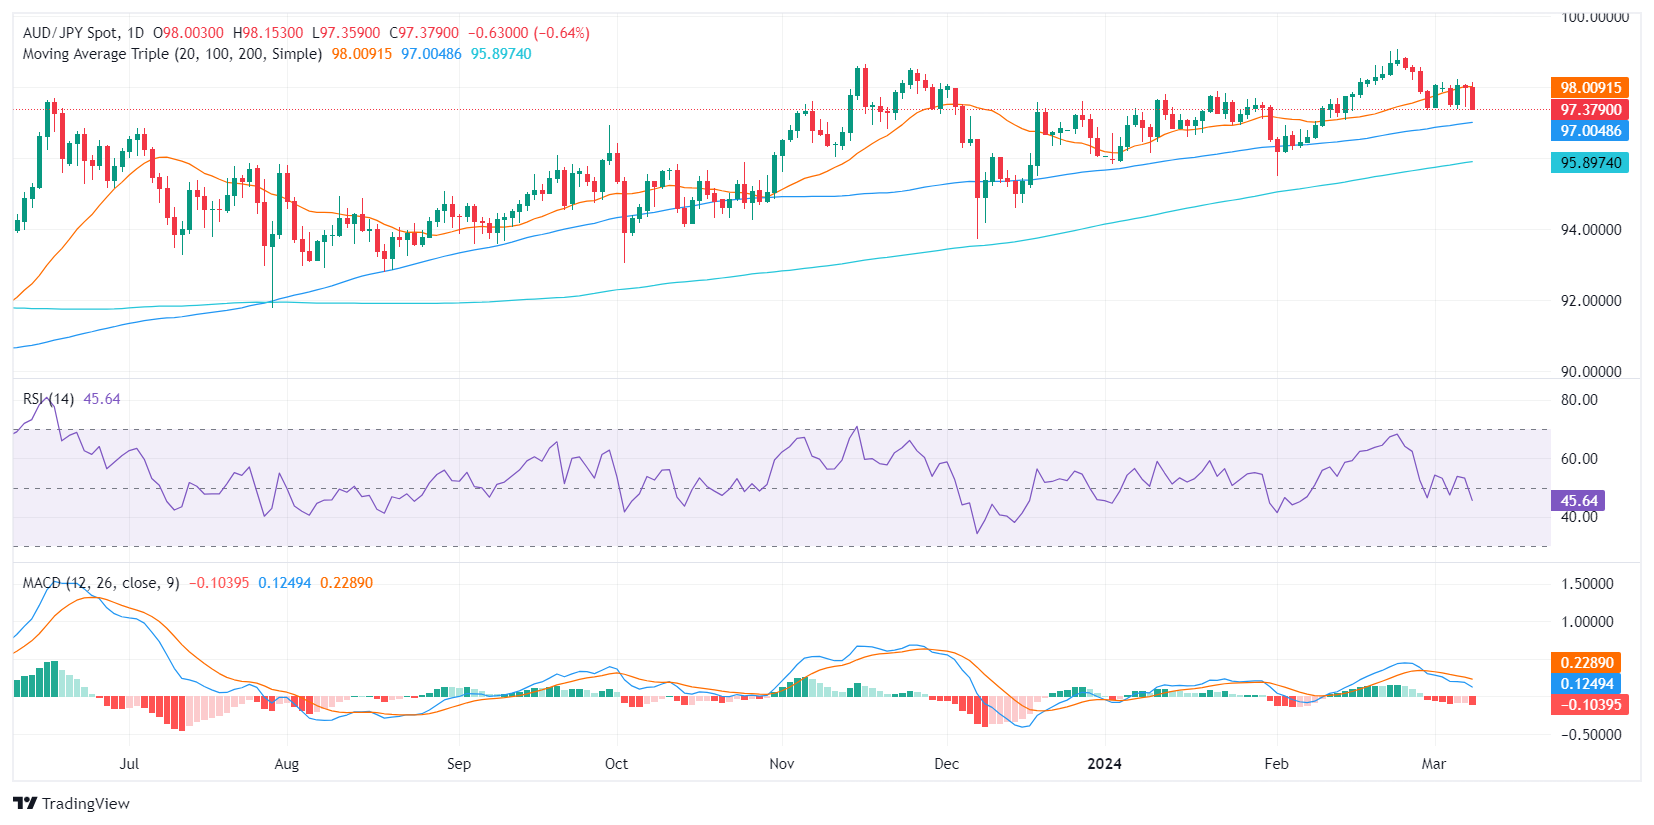
Analyzing the daily chart, the pair's Relative Strength Index (RSI) sits in negative territory, showcasing stronger selling momentum. In line with that, the Moving Average Convergence Divergence (MACD) histogram shows increasing negative momentum with rising red bars. Despite the ongoing bearish tendency, the pair manages to stay above the 100 and 200-day Simple Moving Averages (SMAs), which signifies a favorable condition for the bulls overall.

AUD/JPY daily chart

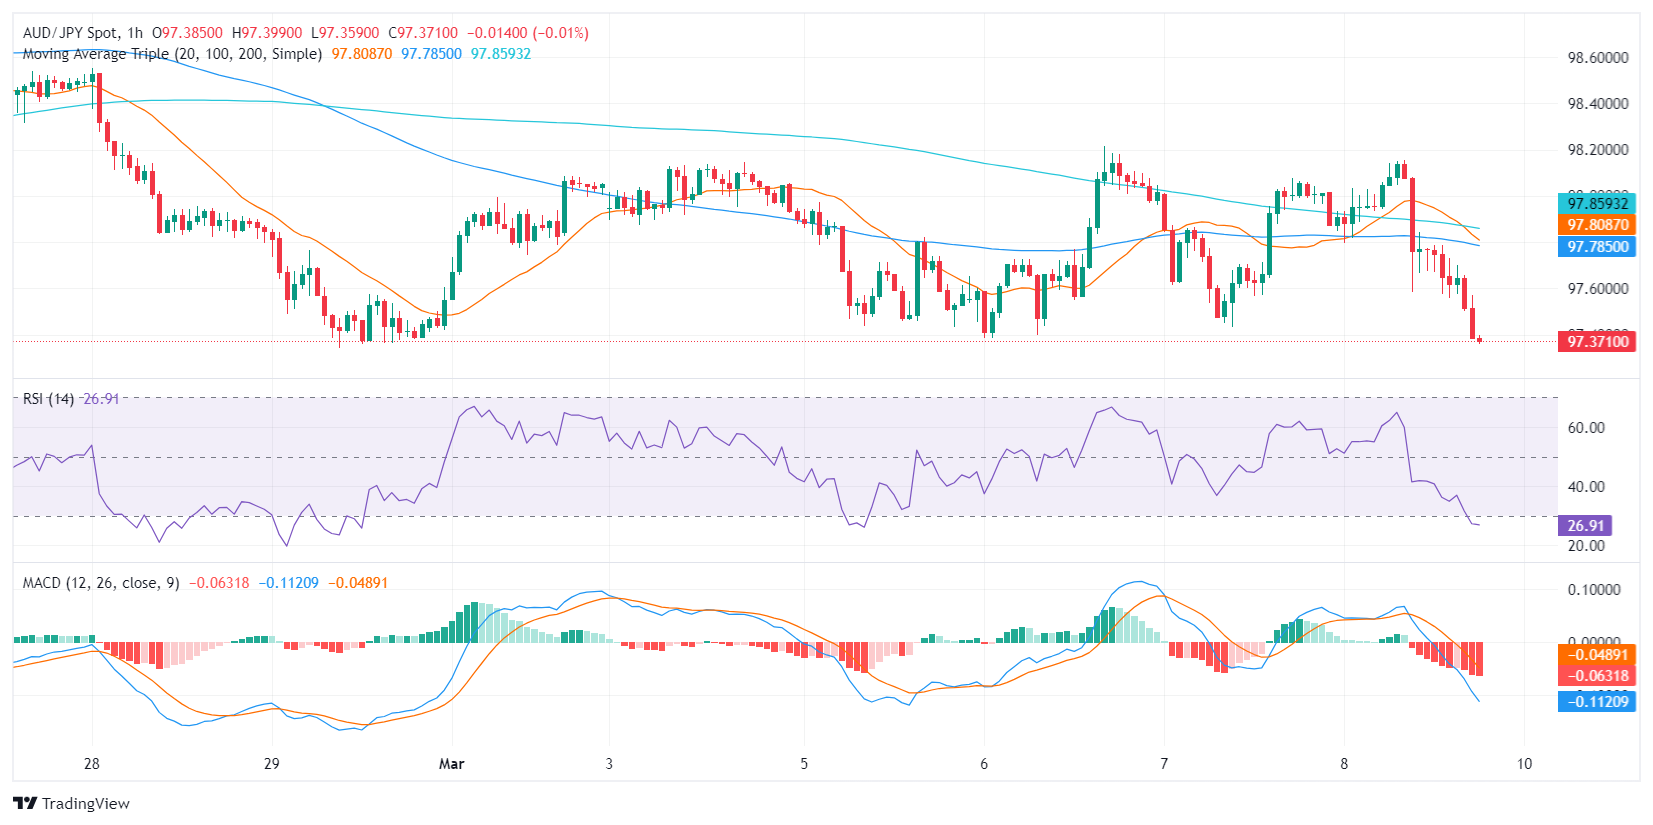
Zooming to the hourly chart, the RSI is currently located in the oversold territory, contrasting sharply with the daily chart, suggesting a possible short-term rebound due to oversold conditions. Likewise, the MACD illustrates increasing negative momentum on the hourly chart, aligning with the daily analysis. Despite differing conditions outlined in the hourly and daily charts, both depict dominant bearish forces, with bulls maintaining their stance in the broader spectrum and with the possibility of a bullish rebound in the short term.

AUD/JPY hourly chart

AUD/JPY

Overview
Today last price97.38
Today Daily Change-0.63
Today Daily Change %-0.64
Today daily open98.01
 
Trends
Daily SMA2098.01
Daily SMA5097.35
Daily SMA10096.98
Daily SMA20095.87
 
Levels
Previous Daily High98.1
Previous Daily Low97.43
Previous Weekly High98.84
Previous Weekly Low97.34
Previous Monthly High99.06
Previous Monthly Low95.5
Daily Fibonacci 38.2%97.69
Daily Fibonacci 61.8%97.84
Daily Pivot Point S197.6
Daily Pivot Point S297.18
Daily Pivot Point S396.93
Daily Pivot Point R198.26
Daily Pivot Point R298.51
Daily Pivot Point R398.93

Author

Patricio Martín

Patricio is an economist from Argentina passionate about global finance and understanding the daily movements of the markets.

More from Patricio Martín
Share:

Editor's Picks

AUD/USD eyes 0.7150 barrier nine-day EMA

AUD/USD inches higher after registering modest losses in the previous day, trading around 0.7130 during the Asian hours. The technical analysis of the daily chart indicates that the pair is moving sideways within the rectangle pattern, suggesting a consolidation as neither the bulls nor the bears have enough momentum to take control of the market.

USD/JPY trades below 160.00 intervention threshold; bullish bias intact

The USD/JPY pair attracts some sellers during the Asian session amid fears that authorities will step in again to prop up the Japanese Yen. Furthermore, the Israel-Lebanon truce prompts some profit-taking around the US Dollar and exerts downward pressure on the currency pair.

Gold defends 200-day SMA at $4,425, but for how long?

Gold is attempting a tepid recovery toward $4,500 early Thursday, as renewed optimism in the Mideast geopolitical front calms market nerves. This cautious optimism across Asian markets weighs on Oil prices, and diminishes the US Dollar’s safe-haven appeal, helping Gold stage a decent comeback from the weekly low of $4,424.


Hyperliquid: ETF demand, capital rotation fuel HYPE rally as Bitcoin melts

Hyperliquid price sustains an upward trend near its all-time high of $75.76 on Thursday after posting 80% gains in May, while Bitcoin (BTC) retraces below $65,000, triggering a market-wide panic.

Kevin Warsh takes the Fed helm: What it means for the US Dollar
The Federal Reserve moves away from the highly predictable "forward guidance" model of the Jerome Powell era to a new “Kevin Warsh environment”, characterized by less communication, more policy surprises, and an increased focus on the Fed's complex balance sheet.
Recession on paper: What really moves the Canadian Loonie now?

Statistics Canada handed the headline writers a gift and the analysts a headache. Real GDP shrank 0.1% on an annualized basis in the first quarter, and with the fourth quarter of 2025 revised down to a 1.0% contraction, that is two negative quarters in a row, the textbook definition of a technical recession and Canada's first since the pandemic.