ASX Elliott Wave technical analysis [Video]
![ASX Elliott Wave technical analysis [Video]](https://editorial.fxsstatic.com/images/i/General-Stocks_3_XtraLarge.png)
ASX: ASX LIMITED – ASX Elliott Wave Technical Analysis TradingLounge.
Today's Elliott Wave analysis provides an updated outlook on the Australian Stock Exchange (ASX LIMITED – ASX). We observe significant upside potential with the third wave of the third wave, indicating strong growth opportunities for ASX LIMITED. This analysis highlights key trend perspectives and important confirmation points for potential trend changes.
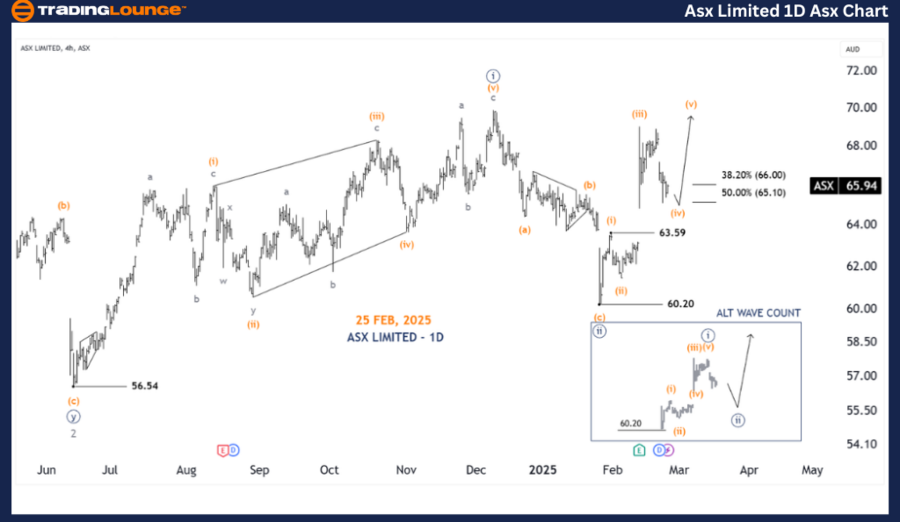
ASX one day chart (Semilog scale) analysis
-
Function: Major Trend (Minor Degree, Grey).
-
Mode: Motive.
-
Structure: Impulse.
-
Position: Wave ((iii)) - Navy of Wave 3 - Grey.
Details:
Wave 3 - Grey appears to be unfolding as an Extended Wave, with Wave ((iii)) - Navy continuing to move higher. This third wave of the third wave suggests a strong bullish trend and significant upside potential.
-
Invalidation point: 60.20.
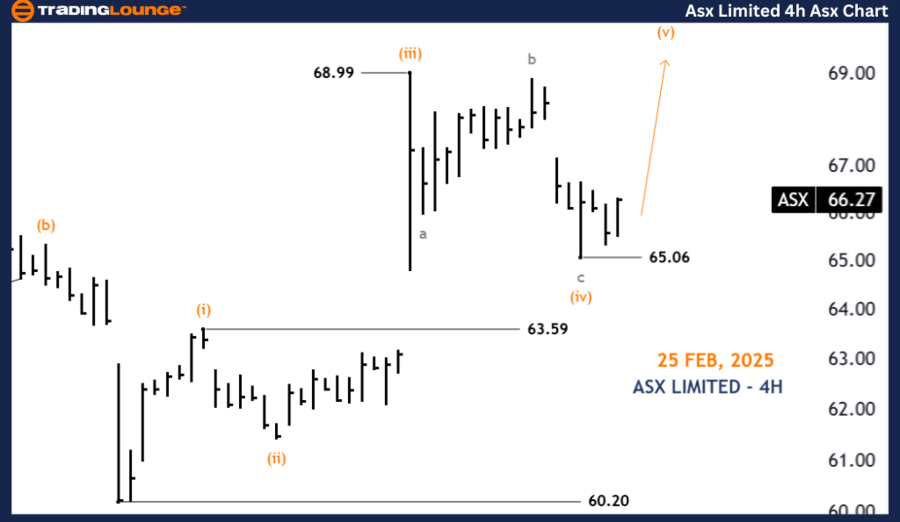
ASX four-hour chart analysis
-
Function: Major Trend (Minor Degree, Grey).
-
Mode: Motive.
-
Structure: Impulse.
-
Position: Wave (v) - Orange of Wave ((iii)) - Navy.
Details:
On the 4-hour chart, the wave structure becomes more defined. It appears that Wave (iv) - Orange has ended, and Wave (v) - Orange is now advancing. The nearest target for this wave is 68.99, provided the price stays above 65.06 to maintain this bullish outlook.
-
Invalidation point: 65.05.
Conclusion:
Our market trend analysis and short-term outlook for ASX LIMITED – ASX provide insights into the current market dynamics and trading opportunities. By identifying key price levels for validation or invalidation of our Elliott Wave count, we enhance confidence in our perspective. Through a structured approach, we aim to deliver objective and professional insights for traders and investors.
Technical analyst: Hua (Shane) Cuong, CEWA-M (Master’s Designation).
ASX Elliott Wave technical analysis [Video]
Author

Peter Mathers
TradingLounge
Peter Mathers started actively trading in 1982. He began his career at Hoei and Shoin, a Japanese futures trading company.


