ASX Elliott Wave forecast [Video]
![ASX Elliott Wave forecast [Video]](https://editorial.fxstreet.com/images/Markets/Equities/Industries/Automobiles/car-engine-637322356428414665.jpg)
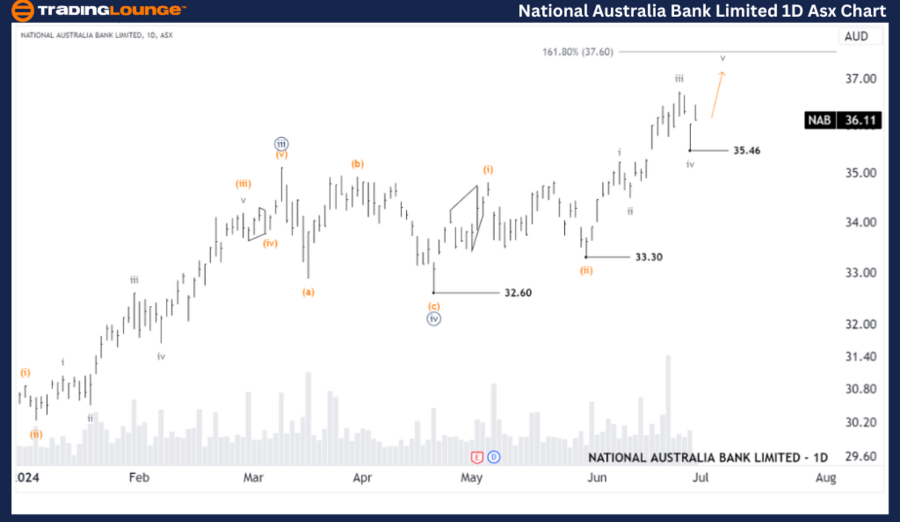
ASX: NATIONAL AUSTRALIA BANK LIMITED - NAB Elliott Elliott Wave Technical Analysis TradingLounge (1D Chart).
Greetings, Our Elliott Wave analysis today updates the Australian Stock Exchange (ASX) with NATIONAL AUSTRALIA BANK LIMITED - NAB . We see that wave (iii)-orange of wave ((v))-navy is opening up to push even higher. The most recent Long Trade position at Trade Recommendations generated quite good profits.
ASX: National Australia Bank Limited - NAB Elliott Wave technical analysis
ASX: NATIONAL AUSTRALIA BANK LIMITED - NAB 1D Chart (Semilog Scale) Analysis.
Function: Major trend (Minute degree, navy).
Mode: Motive.
Structure: Impulse.
Position: Wave v-grey of Wave (iii)-orange of Wave ((v))-navy.
Details: The short-term outlook suggests wave (iii)-orange is unfolding to push higher. Wave ((3))-navy of iii-grey continues to open, if it penetrates the 36.50 level, it will continue towards the 37.60 level. The Long position has had quite good profits.
Invalidation point: 35.46.
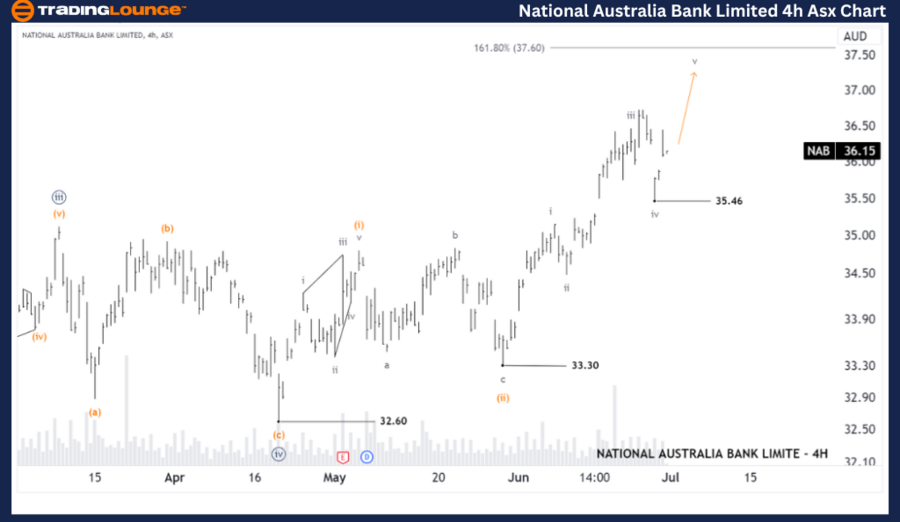
ASX: NATIONAL AUSTRALIA BANK LIMITED - NAB Elliott Wave Technical Analysis TradingLounge (4-Hour Chart).
ASX: National Australia Bank Limited - NAB Elliott Wave Technical Analysis
ASX: NATIONAL AUSTRALIA BANK LIMITED - NAB 4-Hour Chart Analysis.
Function: Major trend (Minuette degree, orange).
Mode: Motive.
Structure: Impulse.
Position: Wave v-grey of Wave (iii)-orange.
Details: The shorter-term outlook shows that the v-grey wave may have recently ended as an Expanded Flat, and the v-grey wave is being opened up to push higher, possibly targeting 37.60.
Invalidation point: 35.46.
Conclusion
Our analysis, forecast of contextual trends, and short-term outlook for ASX: NATIONAL AUSTRALIA BANK LIMITED - NAB aim to provide readers with insights into the current market trends and how to capitalize on them effectively. We offer specific price points that act as validation or invalidation signals for our wave count, enhancing the confidence in our perspective. By combining these factors, we strive to offer readers the most objective and professional perspective on market trends.
Technical analyst: Hua (Shane) Cuong, CEWA-M (Master’s Designation).
ASX: National Australia Bank Limited - NAB Elliott Wave Technical Analysis [Video]
Author

Peter Mathers
TradingLounge
Peter Mathers started actively trading in 1982. He began his career at Hoei and Shoin, a Japanese futures trading company.


