Are new record highs in play?

The S&P 500 is likely to open slightly above 6,400 - but will it keep climbing?
CURRENT TRADING IDEAS (not investment advice; make your own decisions)
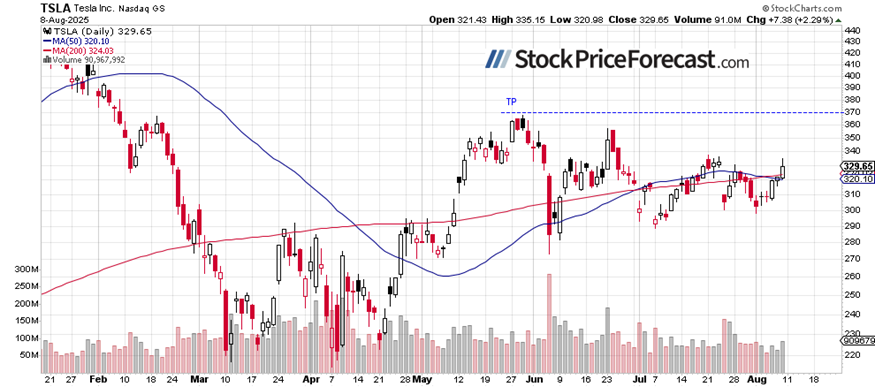
In the premium version of this article, in addition to the VBS system for the S&P 500 index, I include stock trades. Today, I am sharing one of them - a long position in TSLA opened on July 14, which is currently showing a profit of +$11.92 (+3.8%).
Stock trading idea - (TSLA) Tesla stock | Entry: Long since $317.73 (July 14, 2025) | Target: $370.00 | Stop Loss: $270.00 | Expected Duration: 1-2 weeks.
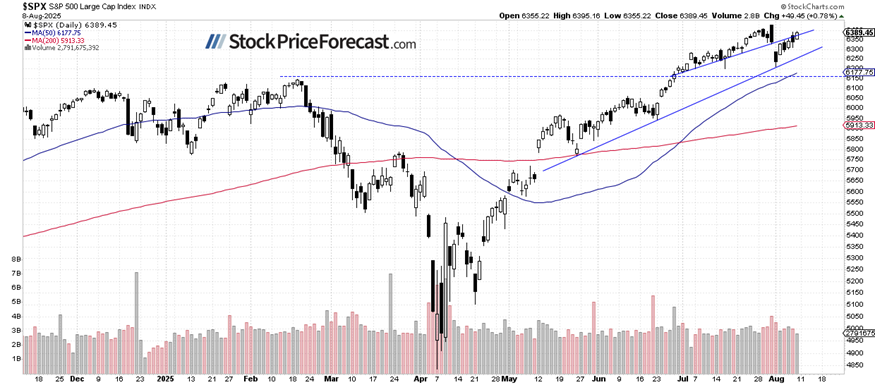
Stocks were gaining on Friday, with the S&P 500 index closing 0.78% higher on hopes of a potential Russia-Ukraine peace deal, tariff-related developments, earnings releases, and other factors. The market has continued retracing the previous week’s sell-off. Today, the S&P 500 is expected to open 0.2% higher, though a short-term consolidation seems likely.
Investor sentiment has deteriorated, as reflected in last Wednesday’s AAII Investor Sentiment Survey, which reported that 34.9% of individual investors are bullish, while 43.2% are bearish.
The S&P 500 is slowly creeping higher, as shown on the daily chart.
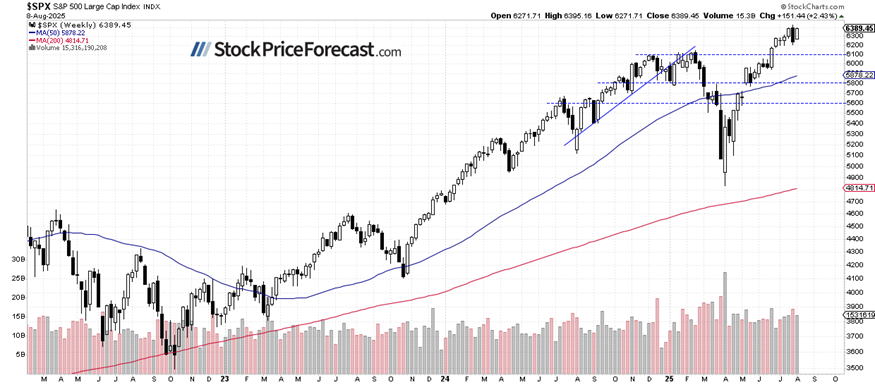
Weekly chart: S&P 500 retraces declines
Last week, the S&P 500 gained 2.43%, reversing the previous week’s 2.4% loss.
For now, this appears to be a consolidation following the advance from the April lows; however, a deeper correction remains possible.
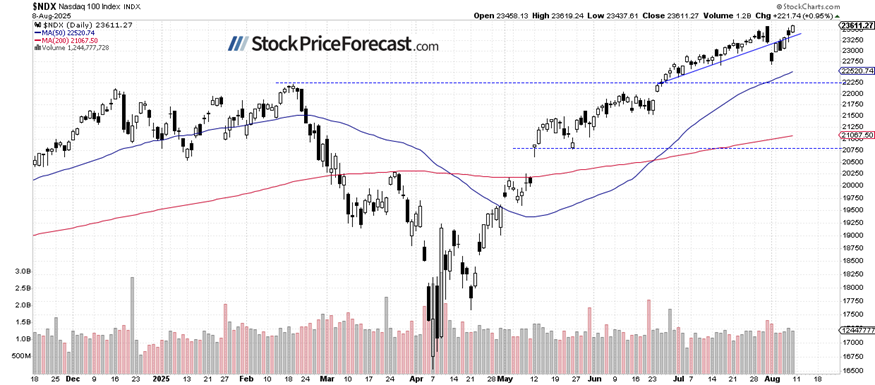
Nasdaq 100 reaches new record
The Nasdaq 100 closed 0.95% higher on Friday after reaching a new all-time high of 23,619.24. Recently, the tech sector has been driven higher by Apple’s rally and AI-related news. Resistance is now around 24,000, with support at 23,300.
While there are no strong bearish signals yet, the recent price action may be forming a potential topping pattern.
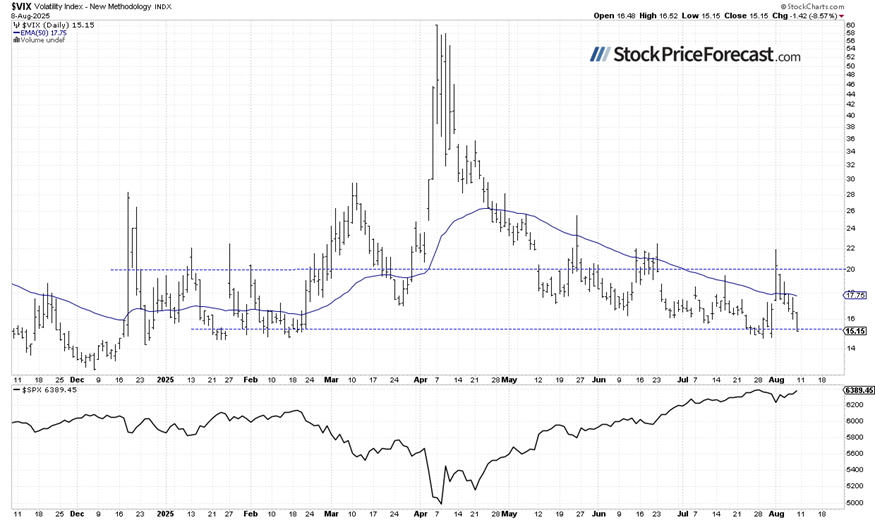
Volatility declined toward 15
On Friday, the VIX (Volatility Index) dipped to a local low of 15.15, confirming reduced investor fear.
Recently, the decline in VIX reflected declining investor fear (declining gold prices indicate the same thing).
Historically, a dropping VIX indicates less fear in the market, and rising VIX accompanies stock market downturns. However, the lower the VIX, the higher the probability of the market’s downward reversal. Conversely, the higher the VIX, the higher the probability of the market’s upward reversal.
Stock trading idea - TSLA
A long position in TSLA was opened on July 14 at $317.73, with an initial stop-loss at $270.00 and a profit target of $370.00. A rebound toward prior highs - and possibly a breakout - looks likely.
Expected duration of the trade was 1-2 weeks; I'll keep you updated about any changes in the outlook.
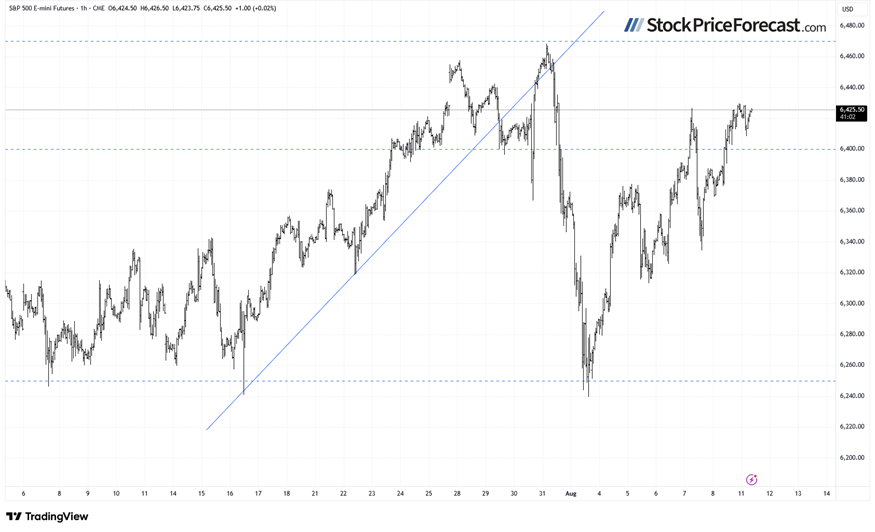
S&P 500 futures contract attempting to break higher
This morning, the S&P 500 futures contract is trading near its local high from Wednesday of around 6,425. Resistance is around 6,450, with support now at 6,400–6,410.
Market outlook: Moving near new records
Stocks retraced Thursday’s pullback on Friday, with gains in AI-related stocks and a more than 4% rally in Apple shares. It seems that stocks may be forming a topping pattern ahead of a more meaningful downward correction, though attempts at reaching new record highs are still possible.
There will be more earnings releases this week, but the market will likely focus on economic data - tomorrow brings the key Consumer Price Index (CPI), followed by the Producer Price Index (PPI) on Thursday and Retail Sales on Friday.
Here's what I think is most likely:
-
The S&P 500 has neared its record highs, retracing earlier losses; the Nasdaq 100 has set a new record, but uncertainty may return ahead of earnings and economic data.
-
My Volatility Breakout System flipped to a long position last week and is currently in profit.
-
My long position in TSLA stock from mid-July remains profitable.
Want free follow-ups to the above article and details not available to 99%+ investors? Sign up to our free newsletter today!
Want free follow-ups to the above article and details not available to 99%+ investors? Sign up to our free newsletter today!
Author

Paul Rejczak
Sunshine Profits
Paul Rejczak is a stock market strategist who has been known for the quality of his technical and fundamental analysis since the late nineties.


