Apple stock slips lower following Barclays channel check
- Barclays analysts think Apple may be reducing production by 3 million units in current quarter.
- Analysts blame lower perceived demand on slow rollout of Apple AI platform.
- AAPL stock sinks more than 3% on Tuesday, Dow Jones also pulls back.
- Indian factory fire could also reduce supply during upcoming. Indian festival season.
Apple (AAPL) stock was down over 3% on Tuesday afternoon following a negative client note from analysts at Barclays bank. The analysts estimated that Apple was trimming iPhone 16 demand by as much as 3 million units, which would be a worrisome trend so soon after the smartphone’s release.
The Dow Jones Industrial Average (DJIA), which includes Apple stock, is down 0.1%, which makes the best of three leading US indices. The NASDAQ has plunged 1.2% at the time of writing, while the S&P 500 has pulled back 0.6%.
The market is also less enthusiastic on Tuesday after Iran launched a barrage of missiles against Israel after the latter's invasion of southern Lebanon on Monday. Traders are worried that the war could spread to the entire region or involve the United States more directly.
Apple stock news
Barclays surprised the market on Tuesday with a pessimistic outlook for CEO Tim Cook’s Apple. They reported that their conversations with suppliers was tempting them to lower their outlook on iPhone 16 uptake.
"Based on our recent supply chain channel checks, we believe AAPL may just have cut roughly 3M units at a key semiconductor component in iPhones for the Dec-Q, which if confirmed would be the earliest build cut in recent history," said Barclays analysts Tim Long and George Wang.
The iPhone 16 was only released about one month ago, so this news bodes quite poorly for the next year of profits if true. The iPhone still accounts for nearly 60% of Apple revenue.
The Barclays analysts cite the staggered rollout of the Apple Intelligence AI platform as a major barrier to early sales. Apple is slated to launch Apple Intelligence, which is based on OpenAI’s technology, in the US in mid-October. However, the launch of the platform in Europe and China are both predicted to happen sometime next year, which could push initial demand further down the calendar.
Additionally, Apple has a headwind on the supply front. A fire at a Tata Electronics factory in India this past weekend is a cause for concern. Analysts expect that Apple could sell as much as 1.5 million iPhone 14 and 15 units during the Indian festival season in late October and early November. However, the factory fire may cut more than 200,000 units from meeting this figure.
Apple stock chart
Apple stock has recently discovered resistance at the $233 level. On Monday, its advance halted there for the third time. Now it seems likely that this is a signal to sell in the short term. AAPL will need to attempt to hold onto either the 50-day Simple Moving Average (SMA) near $222 or the 100-day SMA at $214. The 200-day SMA is lower down in the chart, trending near a few other historical points of support at $197.50.
The August 5 marketwide plunge saw Apple stock dip to $196, so that price level appears to be seasonal support that might hold if a broader pullback ensues.
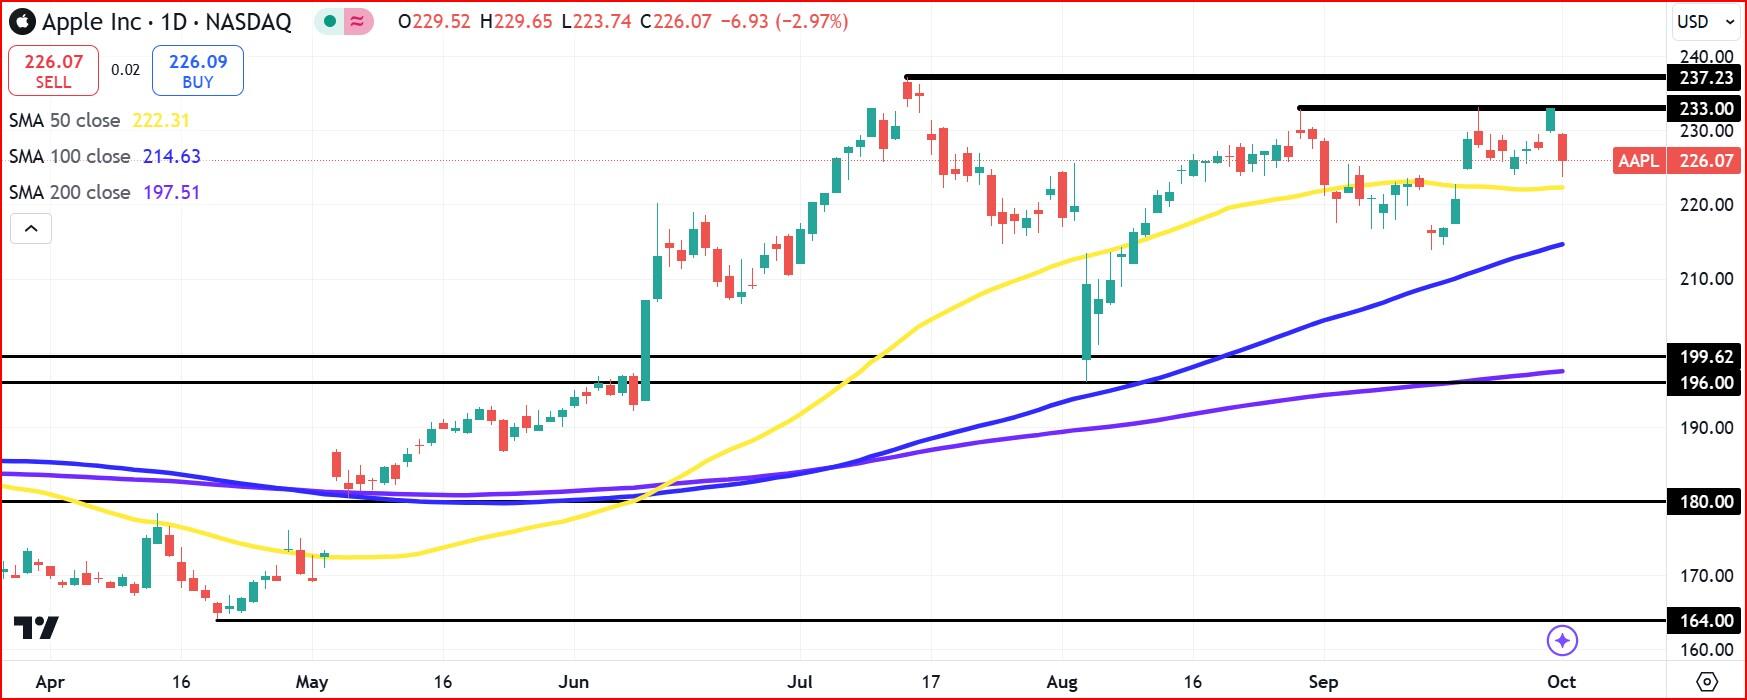
AAPL daily stock chart

Premium
You have reached your limit of 3 free articles for this month.
Start your subscription and get access to all our original articles.
Author

Clay Webster
FXStreet
Clay Webster grew up in the US outside Buffalo, New York and Lancaster, Pennsylvania. He began investing after college following the 2008 financial crisis.


