Apple Stock Forecast: AAPL puts in ugly hammer candle
- Apple stock closes up 0.3% on Monday at $161.02, a new all-time high.
- AAPL price though put in an ugly hammer candle on Monday.
- A hammer candle is a potentially bearish signal, but how reliable is it?

Apple (AAPL) stock once again made all-time highs on Monday despite its recent relatively mediocre earnings release. When a stock or any financial instrument ignores bad news and powers on regardless, you have to follow the sentiment. That is, you have to follow it if you are a short-term trader. Longer-term buy-and-hold investors tend to focus on fundamentals more, but for most of you reading I'm guessing momentum and sentiment is your thing.
Apple had earnings in late October and EPS was bang in line, while revenue missed estimates. This in itself was surprising as most tech companies have been comfortably beating estimates this year. However, Apple never really sold off. It merely consolidated, and this was a base for this fresh move to all-time highs.
-637732660599925442.png)
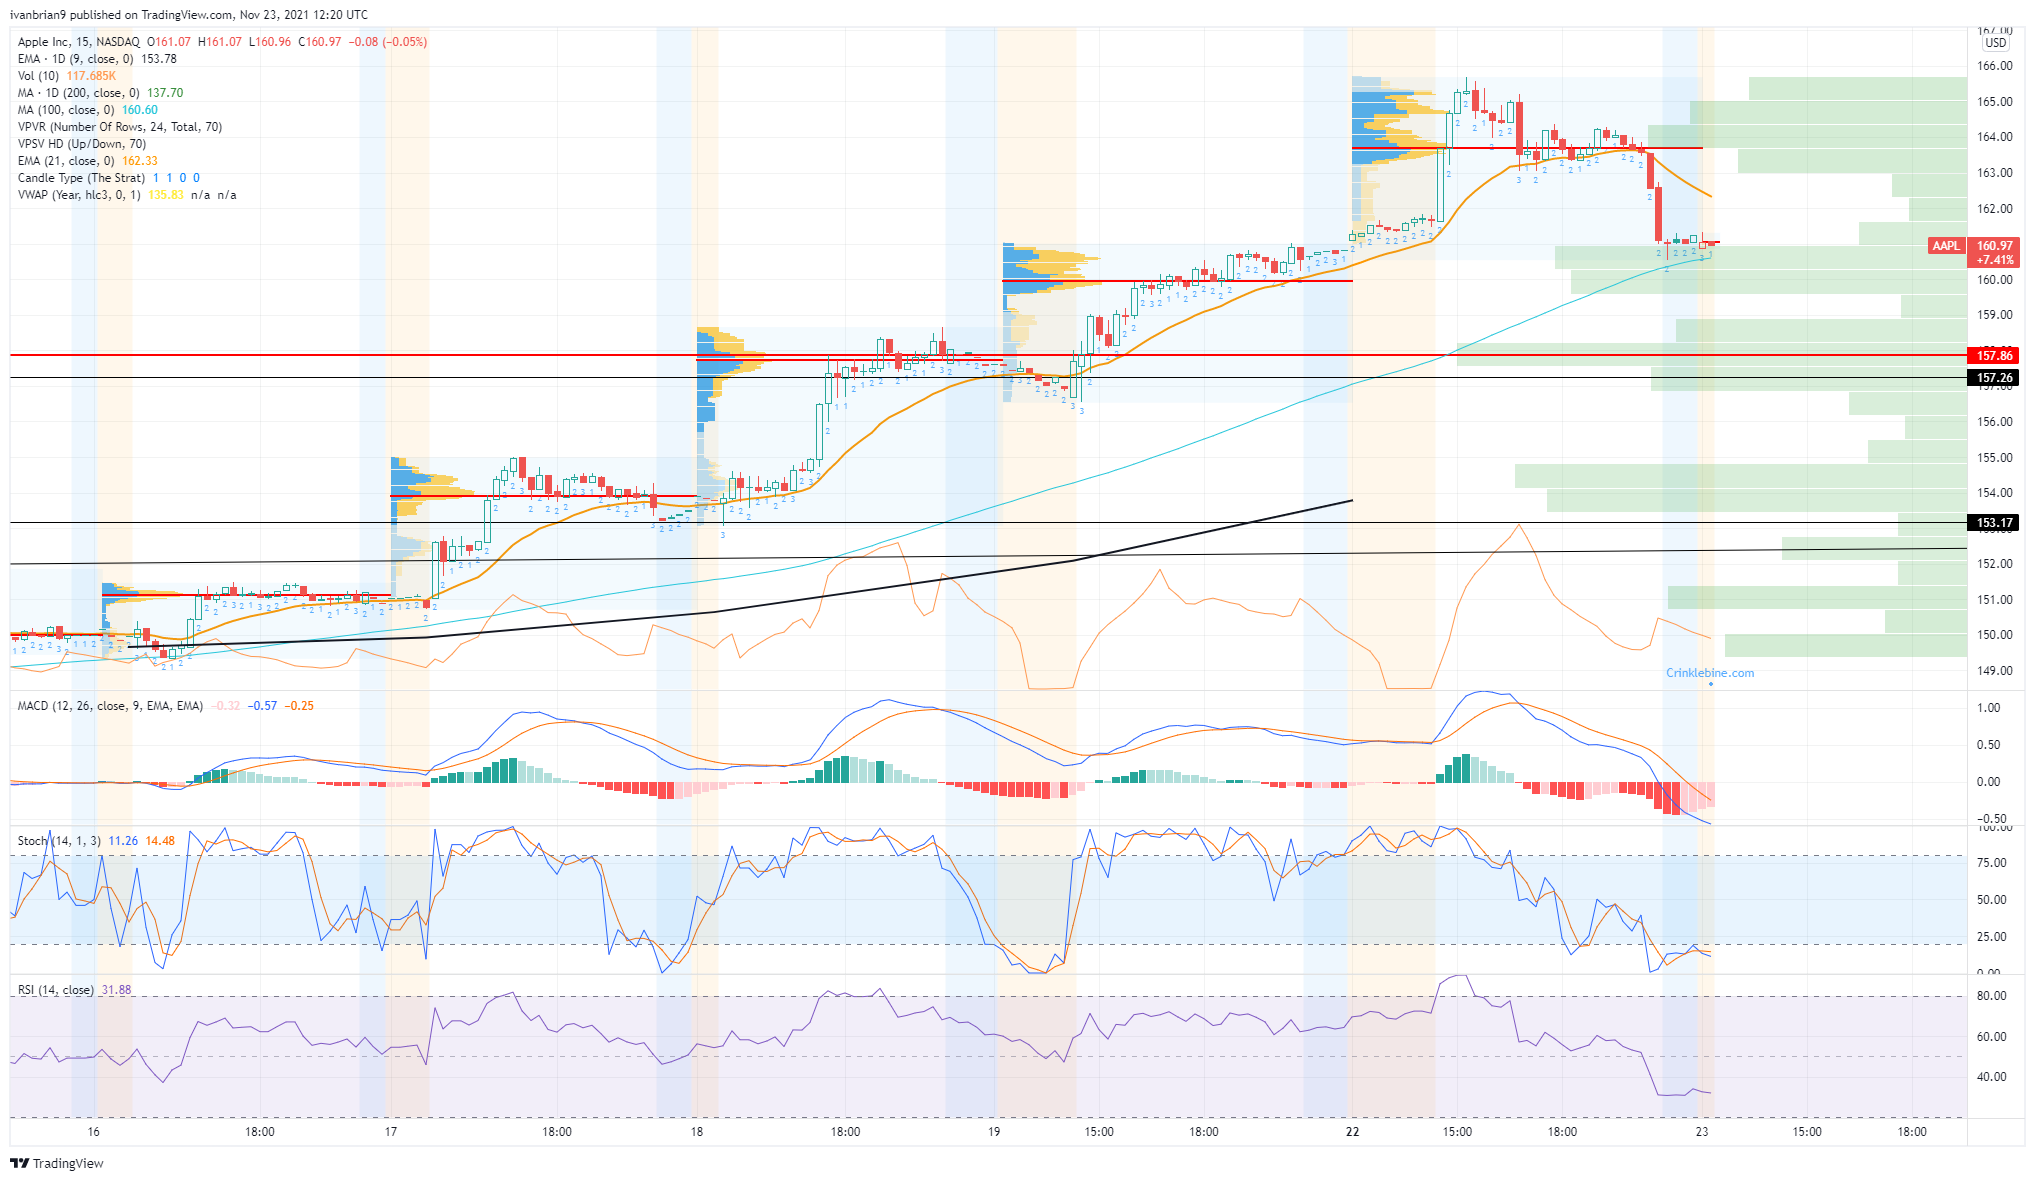
Apple graph, 15-minute
We can see from the intraday chart above that the move happened early and the resultant confirmation of Fed chair Powell led to a sharp sell-off. Why the markets reacted so aggressively to what was fairly well expected by all, we are not so sure. In doing so, however, it created an inverted hammer candle on the day for Apple.
Apple (AAPL) stock news
Some enthusiasm can be put down to news that the long awaited Apple car is imminent, according to a Bloomberg report from late last week. The car is to aim more on the autonomous driving segment with no steering wheel or pedals, according to the report. The electric vehicle sector is the hot sector right now, but this differentiates Apple a little bit. The stock may also have run into headwinds from the news that Italy's antitrust regulator has fined Apple and Amazon, with both companies saying they will appeal the ruling. Apple was fined nearly $135 million, while Amazon was hit with a $68.7 million fine.
Apple (AAPL) stock forecast
This price action has given us an inverted hammer candle. A long tail with a small body at the end of the candle. This results from a low open and close compared to the daily range. An inverted hammer candle is more normally associated with ending a bearish trend. However, it is still a worrying sign in an uptrend. Apple opened calmly before surging higher but this surge was swiftly rejected. That is a negative in our view and so will need to be overcome quickly.
Taking a look at the price action on the 15-minute chart illustrates the resistance area. A large amount of volume and resistance occurred between $164 to $165. This is the short-term resistance that needs to be broken to keep the medium-term rally going. We can see the volume gap from $164 to $160, which is intraday support.
The daily chart shows us the ugly inverted hammer. This, more medium-term view, has $157.26 as support and $153.17 below that. Yesterday's inverted hammer candle has caused the stochastic to give a crossover sell signal, but nothing else yet confirms this. Watch the short-term levels above for confirmation. $165 needs to be broken to keep momentum going.
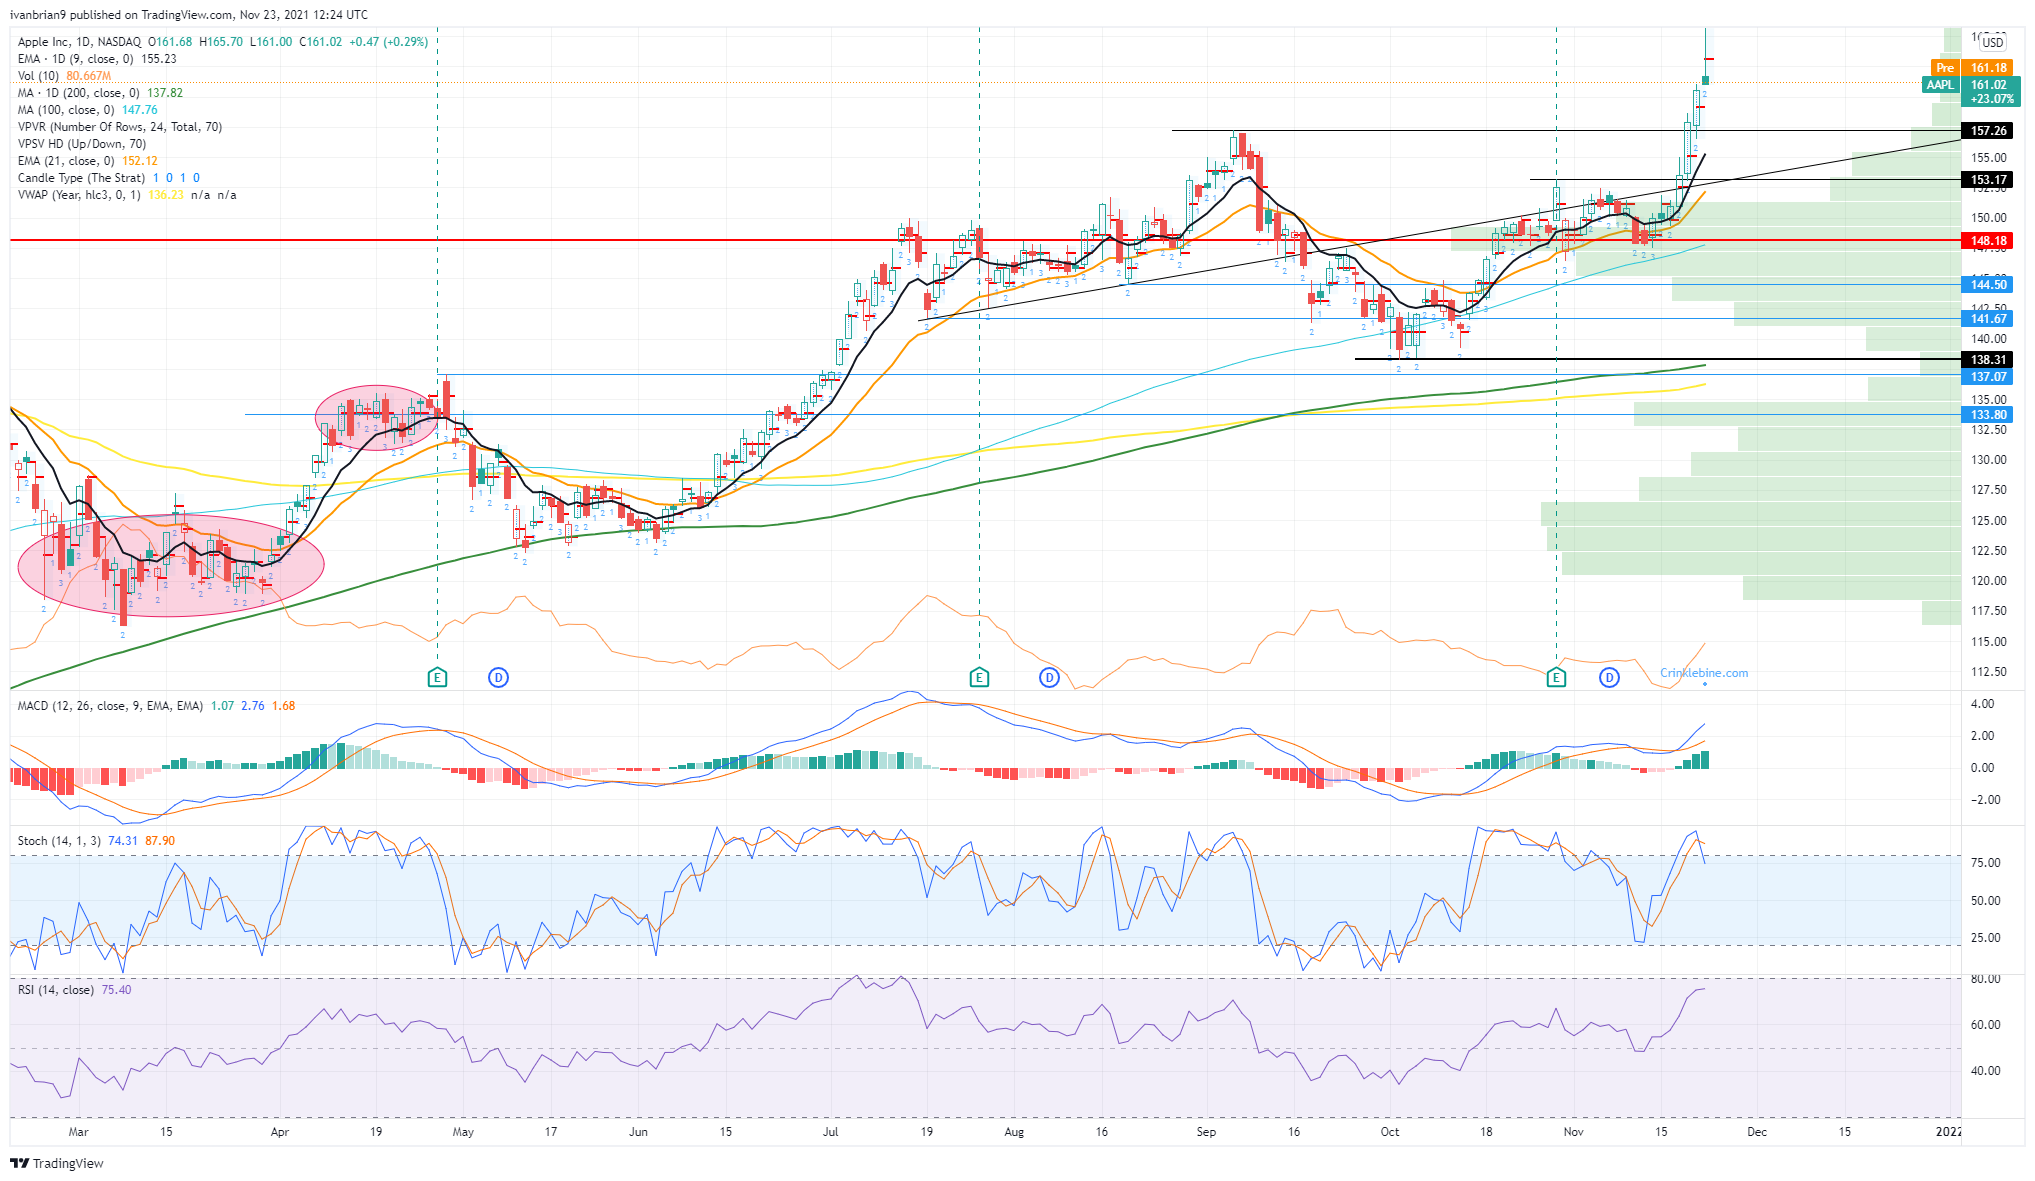
AAPL 1-day chart
Premium
You have reached your limit of 3 free articles for this month.
Start your subscription and get access to all our original articles.
Author

Ivan Brian
FXStreet
Ivan Brian started his career with AIB Bank in corporate finance and then worked for seven years at Baxter. He started as a macro analyst before becoming Head of Research and then CFO.


