Apple Inc. (AAPL) Elliott Wave technical analysis [Video]
![Apple Inc. (AAPL) Elliott Wave technical analysis [Video]](https://editorial.fxstreet.com/images/Markets/Equities/Industries/CommunicationServices/mobile-phone-637435389695511071_XtraLarge.jpg)
AAPL Elliott Wave technical analysis
Function: Trend
Mode: Impulsive
Structure: Motive
Position: Wave (5)
Direction: Upside in wave 3 of (5).
Details: We are looking at Apple being in a larger correction, differentiating from the rest of the major SPX components. We are exploring the possibility of a triangle in wave {b} of 2 or else we could also be in some sort of complex correction swill in wave 2.
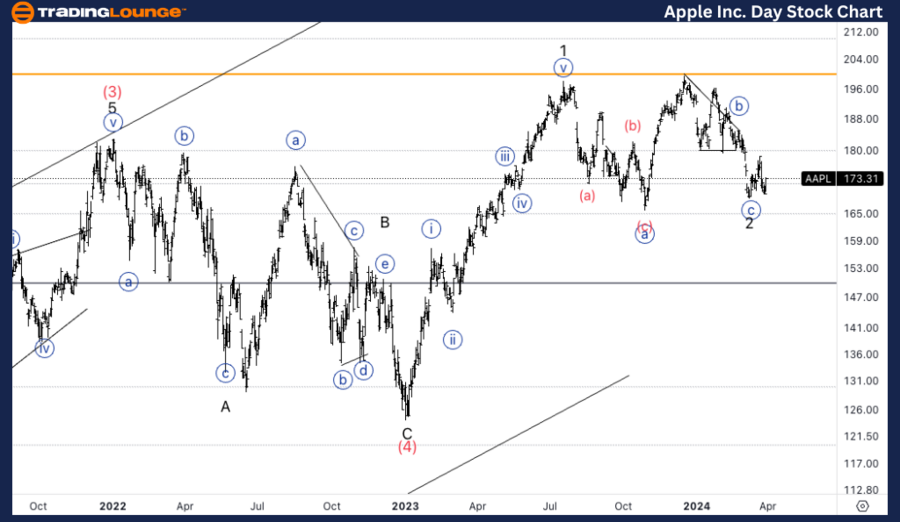
AAPL Elliott Wave technical analysis – Daily chart
Our analysis indicates a trending function characterized by impulsive mode and motive structure, positioned in Wave (5). The direction signals an upside momentum in wave 3 of (5). Apple appears to be undergoing a larger correction, setting it apart from other major SPX components. We're currently exploring the possibility of a triangle formation in wave {b} of 2, or alternatively, we could be experiencing a complex correction within wave 2.
AAPL Elliott Wave technical analysis
Function: Trend
Mode: Impulsive
Structure: Motive
Position: Wave {iii} of 3.
Direction: Upside in wave {iii}.
Details: Here we explore the possibility of further upside into wave {iii} as there is a possibility for a five wave move into wave {i} and we are finding support on the middle of MG2 at 172$. Looking for continuation higher to give us additional confirmation.
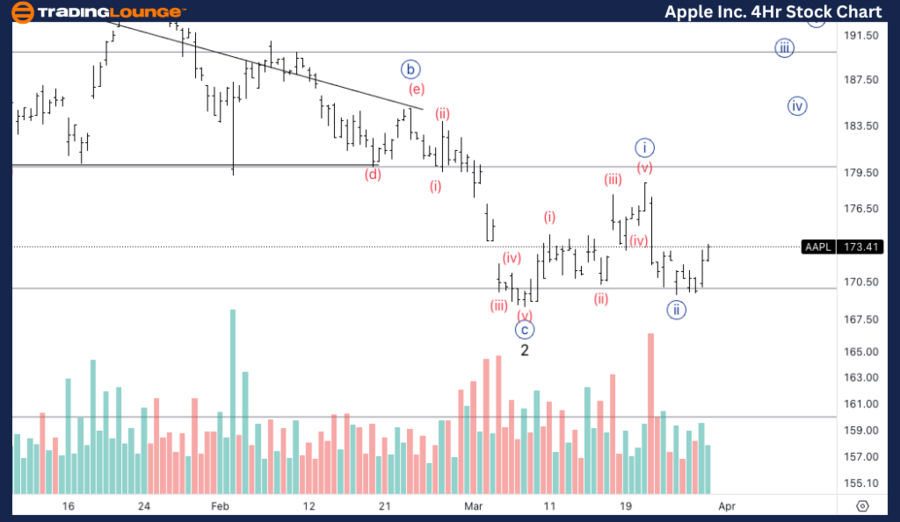
AAPL Elliott Wave technical analysis – Four-hour chart
Here, we also identify a trending function marked by impulsive mode and motive structure, positioned in Wave {iii} of 3. The direction indicates an upside trajectory in wave {iii}. Our analysis suggests the potential for further upside into wave {iii}, supported by the possibility of a five-wave move into wave {i}. We are currently finding support around the middle of MG2 at $172, anticipating continuation higher to provide additional confirmation.
AAPL Elliott Wave technical analysis [Video]
Author

Peter Mathers
TradingLounge
Peter Mathers started actively trading in 1982. He began his career at Hoei and Shoin, a Japanese futures trading company.


