Apple (AAPL) Stock Price and Forecast: 3, 4 or 5 reasons why Apple is falling after results
- Apple stock falls on Wednesday despite posting strong earnings.
- AAPL shares fall 1.2% to close at $144.98.
- Apple posted Q3 earnings after the close on Tuesday that beat expectations.
Apple stock continues to disappoint despite posting strong results on Tuesday after the market closed. It is a case of deja vu for Apple stock, which also fell despite reporting strong Q2 earnings back in late April.
Apple released Q3 2021 results just after the close on Tuesday, July 27. Earnings per share (EPS) were $1.30 versus the $1.00 Wall Street estimate. Revenue was $81.4 billion versus the $72.9 billion estimate. Apple reported Q3 iPhone revenue of $39.6 billion, up from $26.4 billion a year earlier. Apple stock (AAPL) had a little pop just on the release of the numbers, but this swiftly turned around and the stock fell about 1%.
The move continued during the main session on Wednesday with Apple closing just over 1% lower. This is despite some big tech peers rising in the same session. Google (GOOGL) also reported strong numbers and beat estimates. GOOGL shares rallied strongly, closing up over 3% on Wednesday at all-time highs. Why the difference?
-637631517542775814.png)
Apple key statistics
| Market Cap | $2.44 trillion |
| Enterprise Value | $2.1 trillion |
| Price/Earnings (P/E) | 32 |
|
Price/Book | 38 |
| Price/Sales | 9 |
| Gross Margin | 40% |
| Net Margin | 23% |
| EBITDA | $100 billion |
| Average Wall Street rating and price target |
Buy $159 |
Apple stock forecast
The numbers were good, out-of-the-park-style good. Beating EPS by 30% usually satisfies investors, but we live in a different world. If stocks continually beat expectations, which is what is happening, then investors expect the unexpected. Earnings are expected to beat and beat well. Q2 earnings for AAPL stock beat by 40%, but the stock slid from $137 to $122 in the days after the release.
Three reasons why this time may be the same as last time for Apple stock and it falls after beating estimates:
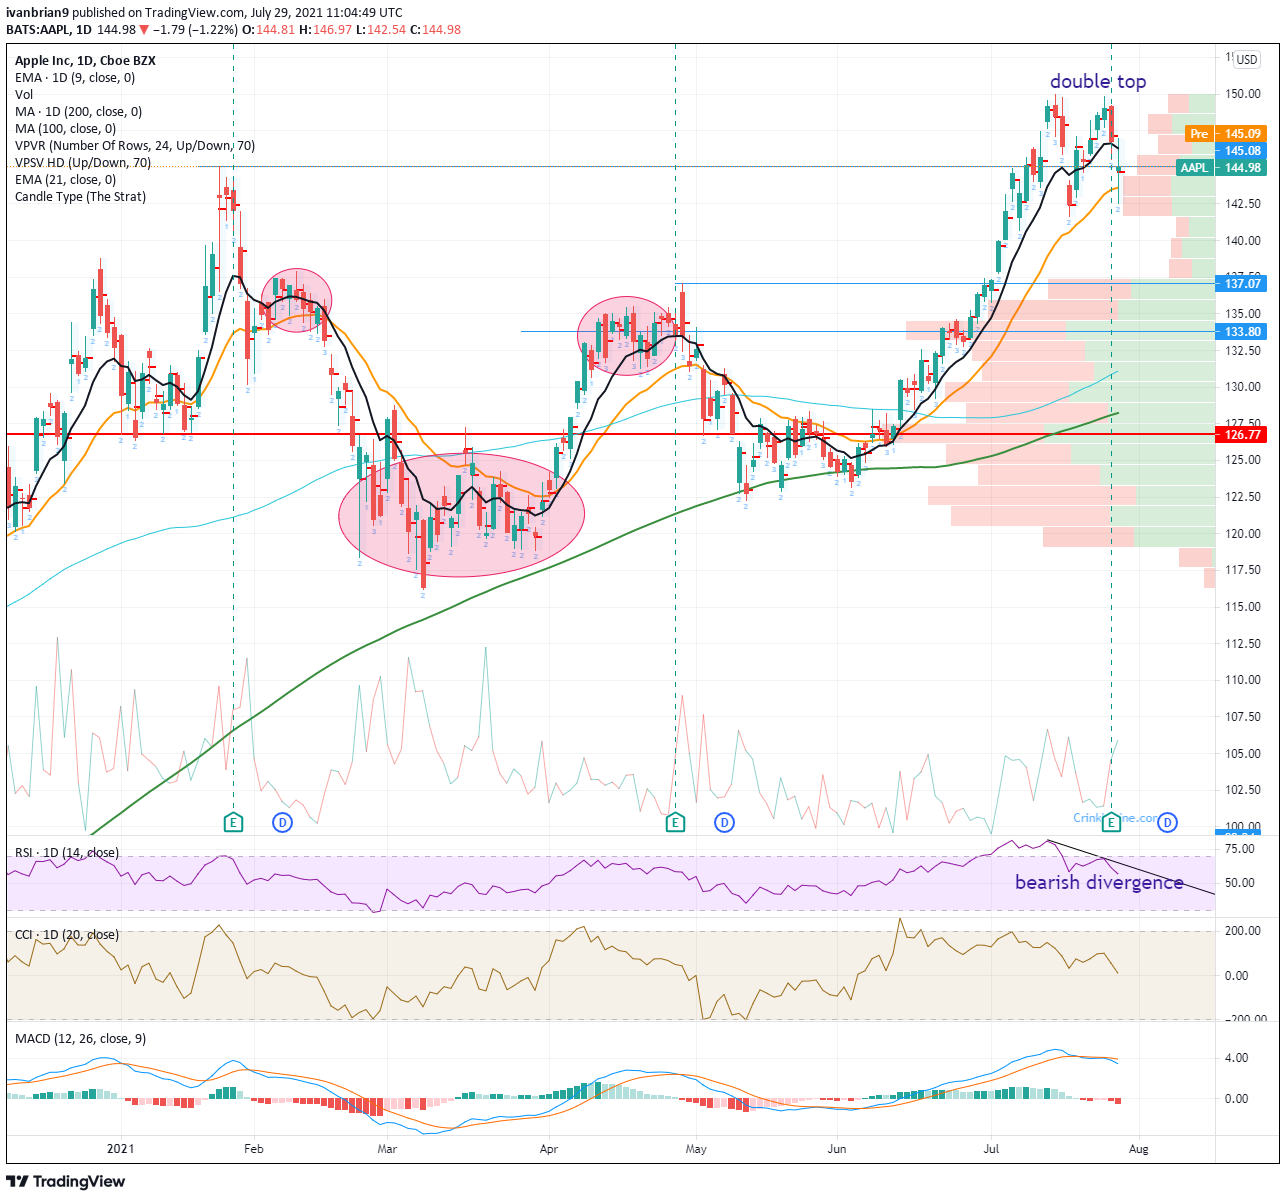
1. Apple failed to break the psychological $150 resistance, and the Moving Average Convergence Divergence (MACD) has crossed into a bearish signal.
2. Apple walloped earnings, but it has done this before, and the stock has fallen. The premarket and regular session move gives us some clue that all is not well with bulls.
3. On the conference call Apple mentioned supply constraints for the iPhone and iPad in Q4 and also guides for that quarter growth to be lower.
4. An extra bonus reason, Apple stock has put in place a perfectly clean double top just shy of psychological resistance at $150. This is not good from a technical view.
5. Another bonus is the bearish divergence in the Relative Strength Index (RSI) and the share price. Apple put in the double top on July 15 and 26. However, the RSI peaked for the first top and then diverged.
The first short-term support was the 9-day moving average at $146.59. This has been broken now, and the 21-day was tested but held so far. $141.67 is the low from July 19, and that now becomes the next target/support. The volume profile shows us clearly that if Apple breaks this $141.67 the move should accelerate as there is no volume to support the price and Apple is on to retrace to $135 and likely $133.80 as that is the high volume area.
Below that, Apple is likely to find support in the mid $120s as this is the area with the highest volume. The 200-day moving average supports the price further here. This is where Apple shares have retreateed to numerous times and regrouped.
Like this article? Help us with some feedback by answering this survey:
Premium
You have reached your limit of 3 free articles for this month.
Start your subscription and get access to all our original articles.
Author

Ivan Brian
FXStreet
Ivan Brian started his career with AIB Bank in corporate finance and then worked for seven years at Baxter. He started as a macro analyst before becoming Head of Research and then CFO.


