Analog Devices Inc.(ADI) Elliott Wave technical analysis [Video]
![Analog Devices Inc.(ADI) Elliott Wave technical analysis [Video]](https://editorial.fxstreet.com/images/TechnicalAnalysis/ChartPatterns/Candlesticks/foreign-exchange-market-chart-24348895_XtraLarge.jpg)
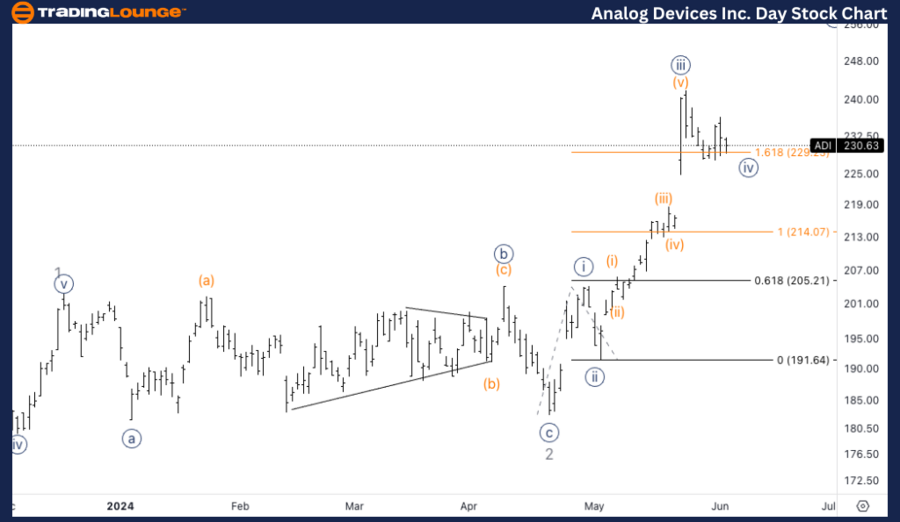
Analog Devices Inc., (ADI) daily chart.
ADI Elliott Wave technical analysis
Function: Trend.
Mode: Impulsive.
Structure: Motive.
Position: Minor 3.
Direction: Top in 3.
Details: We are looking at Minor wave 3 unfolding nicely on the way up, an we are now finding support on the end of MG1 at 230$ as we hit equality of 3 vs. 1.
ADI Elliott Wave technical analysis – Daily chart
In our Elliott Wave analysis of Analog Devices Inc. (ADI), we observe an impulsive trend characterized by a motive structure. ADI is currently positioned in Minor wave 3, suggesting that this wave is unfolding nicely to the upside. We have identified support at the end of MG1 around $230, as the price reaches equality of wave 3 compared to wave 1. Traders should monitor this support level for signs of continuation higher, indicating the potential completion of Minor wave 3.
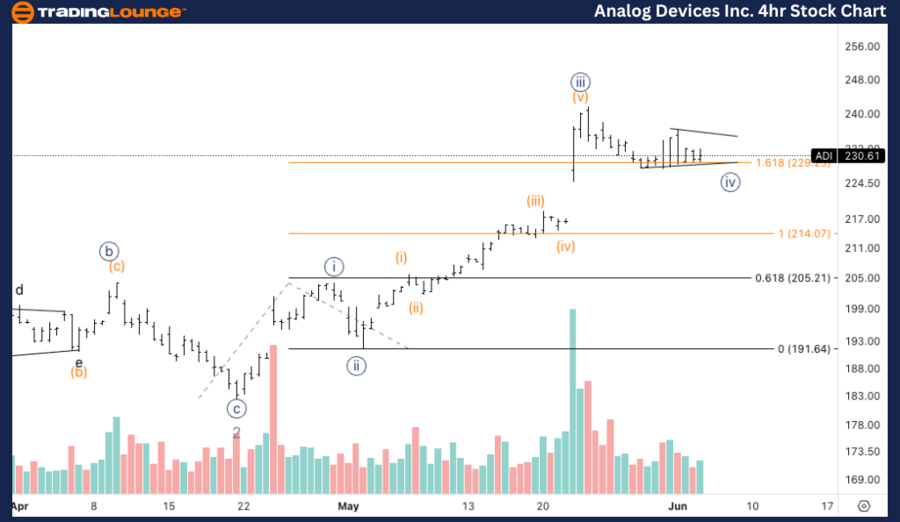
ADI Elliott Wave analysis four-hour chart
On the 4-hour chart, ADI is following an impulsive trend within a motive structure, specifically in wave {iv} of 3. The current analysis indicates a potential sideways consolidation, possibly forming a triangle in wave {iv}, before continuing higher in wave {v}. The next key target for this upward movement is the Medium Level at $250. Traders should look for consolidation patterns and confirmation signals to position themselves for the anticipated upward move.
Function: Trend.
Mode: Impulsive.
Structure: Motive .
Position: Wave {iv} of 3.
Direction: Upside in {v}.
Details: Looking for sideways consolidation, potentially in a triangle, in wave {iv} to then continue higher towards Medium Level at 250$.
Welcome to our latest Elliott Wave analysis for Analog Devices Inc. (ADI) as of June 5, 2024. This analysis provides an in-depth look at ADI's price movements using the Elliott Wave Theory, helping traders identify potential opportunities based on current trends and market structure. We will cover insights from both the daily and 4-hour charts to offer a comprehensive perspective on ADI's market behavior.
Analog Devices Inc.(ADI) Elliott Wave technical analysis [Video]
Author

Peter Mathers
TradingLounge
Peter Mathers started actively trading in 1982. He began his career at Hoei and Shoin, a Japanese futures trading company.


