American Express slips, and the technicals suggest more downside

American Express (AXP) pulled back sharply yesterday, falling more than 4% following news that President Trump plans to cap credit card interest rates at 10%. The reaction was immediate, and given how extended the stock had become, the move lower was not entirely surprising to me.
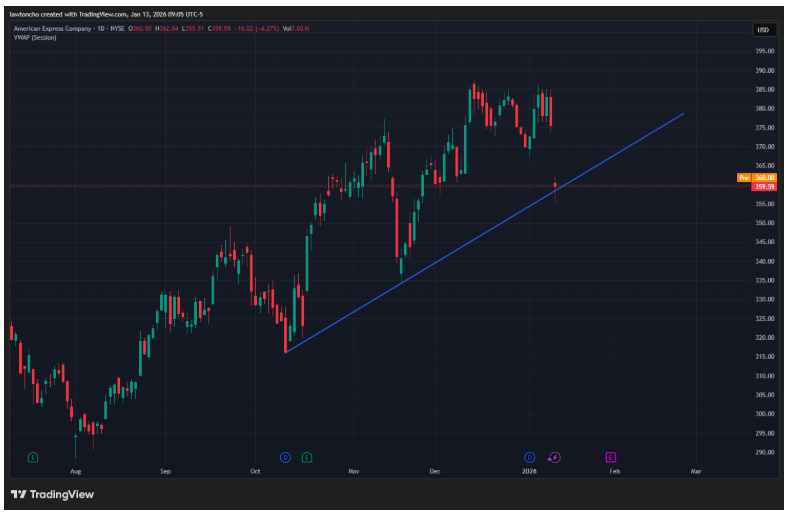
Leading into this drop, AXP had enjoyed a powerful run higher, rallying more than 70% off its Liberation Day lows. That kind of move naturally puts pressure on the chart, especially when momentum begins to stall. When I look at this setup, the recent decline stands out not just because of the headline, but because of what the technicals were already starting to signal.
On the daily timeframe, the stock attempted to break below its upsloping trendline during yesterday’s selloff. From a technical perspective, this is an important development. That trendline has acted as support throughout the entire rally, and when price starts to test — or threaten — that structure, I pay attention. A clean break and confirmation below that upsloping trendline would suggest that downside pressure could continue from here.
From a trading standpoint, I see two clear technical approaches. One option would be to wait for a decisive break and confirmation below the upsloping trendline. Another would be to watch for a retrace back toward that same trendline and look for rejection there. In either case, the chart is offering defined levels, which is exactly what I look for when evaluating risk.
As background, American Express is a well-established financial services company whose stock has long attracted both investors and active traders. Because of its size and visibility, AXP often reacts quickly to policy-related headlines, and those reactions can create meaningful technical setups on the chart. That combination of strong trends and headline sensitivity is part of what makes the name so actively traded.
As always, regardless of bias or setup, I focus on disciplined execution. The technicals may be shifting, but proper risk management remains essential when trading any stock, especially after a prolonged move in one direction.
Author

Lawton Ho
Verified Investing
A marketing expert sharing his journey to mastering the charts.















