AMD Stock Forecast: Advanced Micro Devices price feeling weight of sector shortages
- AMD is a semiconductor company, one of the sectors suffering from shortages.
- Firm is struggling for momentum as a result of negative sentiment.
- AMD shares suffered on Monday with a loss of 5%.

AMD is one of the largest semiconductors manufacturers and is focused on the computing and graphics sector. AMD is one of Intel's main competitors in the pc and laptop chip market.
Stay up to speed with hot stocks' news!
AMD stock price target
Taking a long time frame gives us some perspective of the longer-term trend we are trading with or against. It is pretty clear that AMD is in a long-term bullish trend. Much like the overall market. The move and speed have accelerated recently. Since the price explosion in July 2020 above and through $59.30, AMD has set a new range for itself of $73.92 to $94.25. Yes, we have some spikes higher, but on the weekly chart $94.25 is stronger with many weekly closes at or near this price level. Now that we have established the range we are currently in, digging deeper into the daily chart gives us some more information.
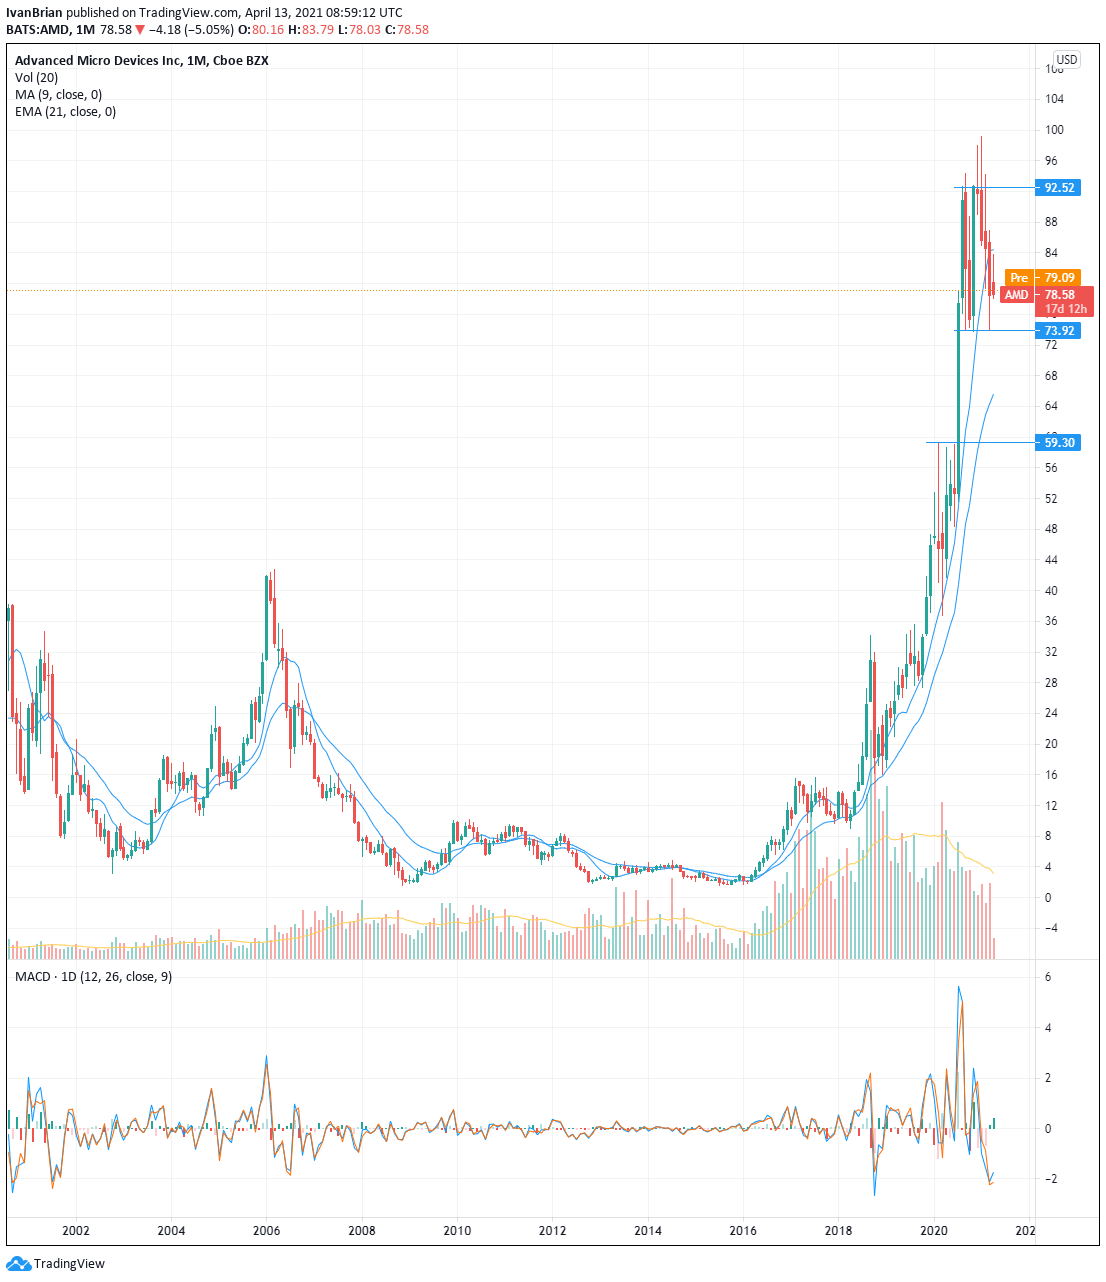
The daily chart does show that we have broken to the upside more than the downside of our range. This is understandable and adds to the overall bullishness. AMD is trying to break upward not downward. However, the failure has led AMD back toward the bottom of the range with a possible test of $73.92 imminent.
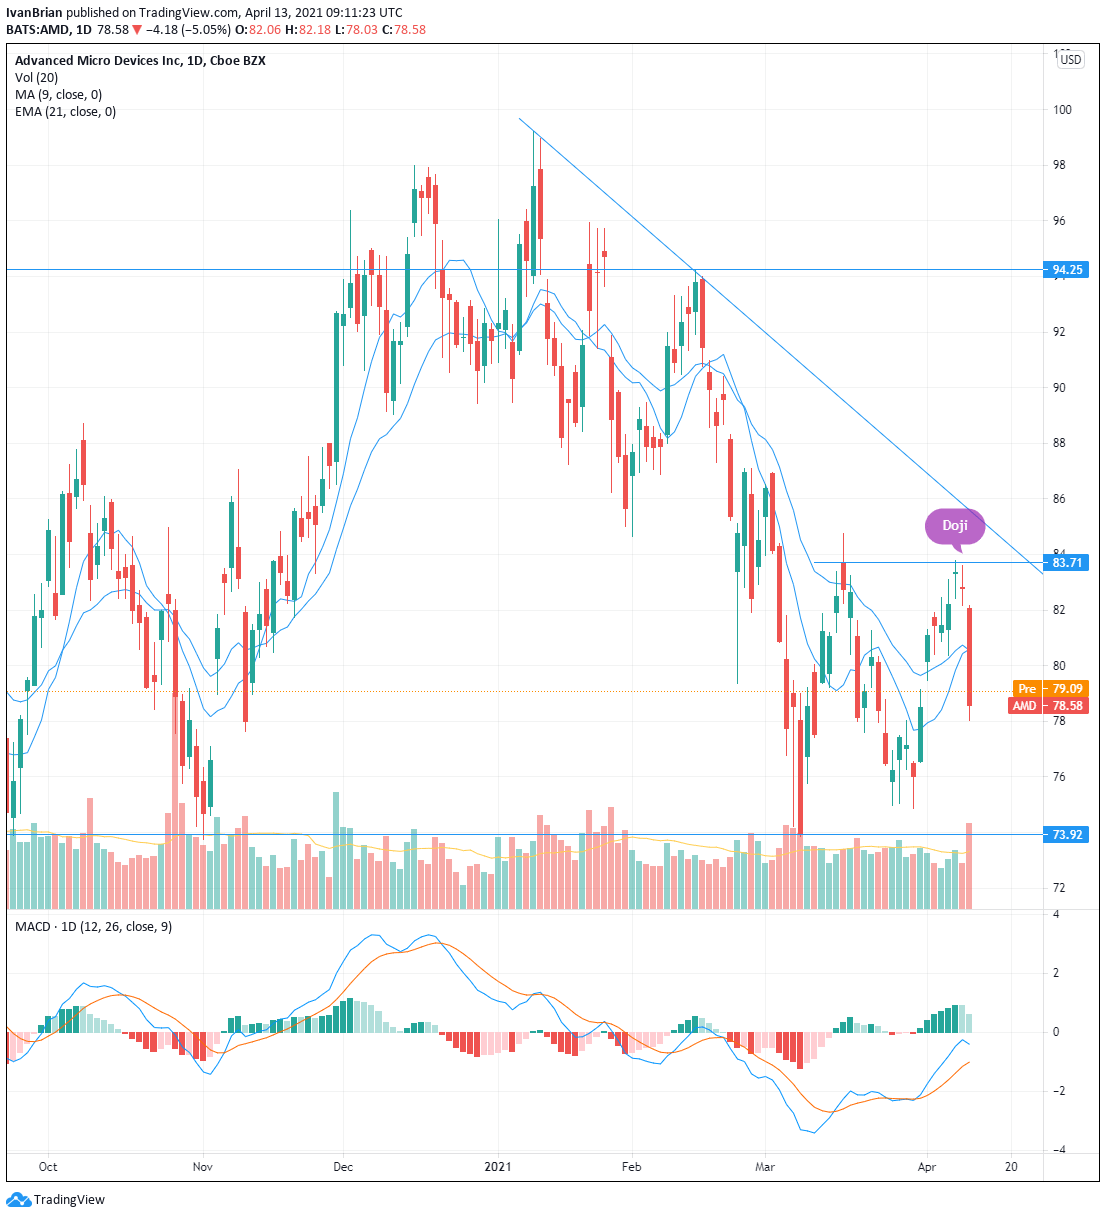
The daily chart looks ugly for bulls after yesterday's nasty candle, which followed from the bearish doji last week. On Monday, AMD lost 5%, breaking through the 9 and 21-day moving averages and so turning bearish in the short term. Taking a long position is out of the question for now. Tuesday's price action will give further clues as to how to position ourselves or whether to wait. It is not always necessary to have a position. Better to wait until some strong signal shows rather than gambling.
The daily chart is still showing that longs are slightly more favoured. The MACD crossed over on March 31, giving a buy signal for AMD shares.
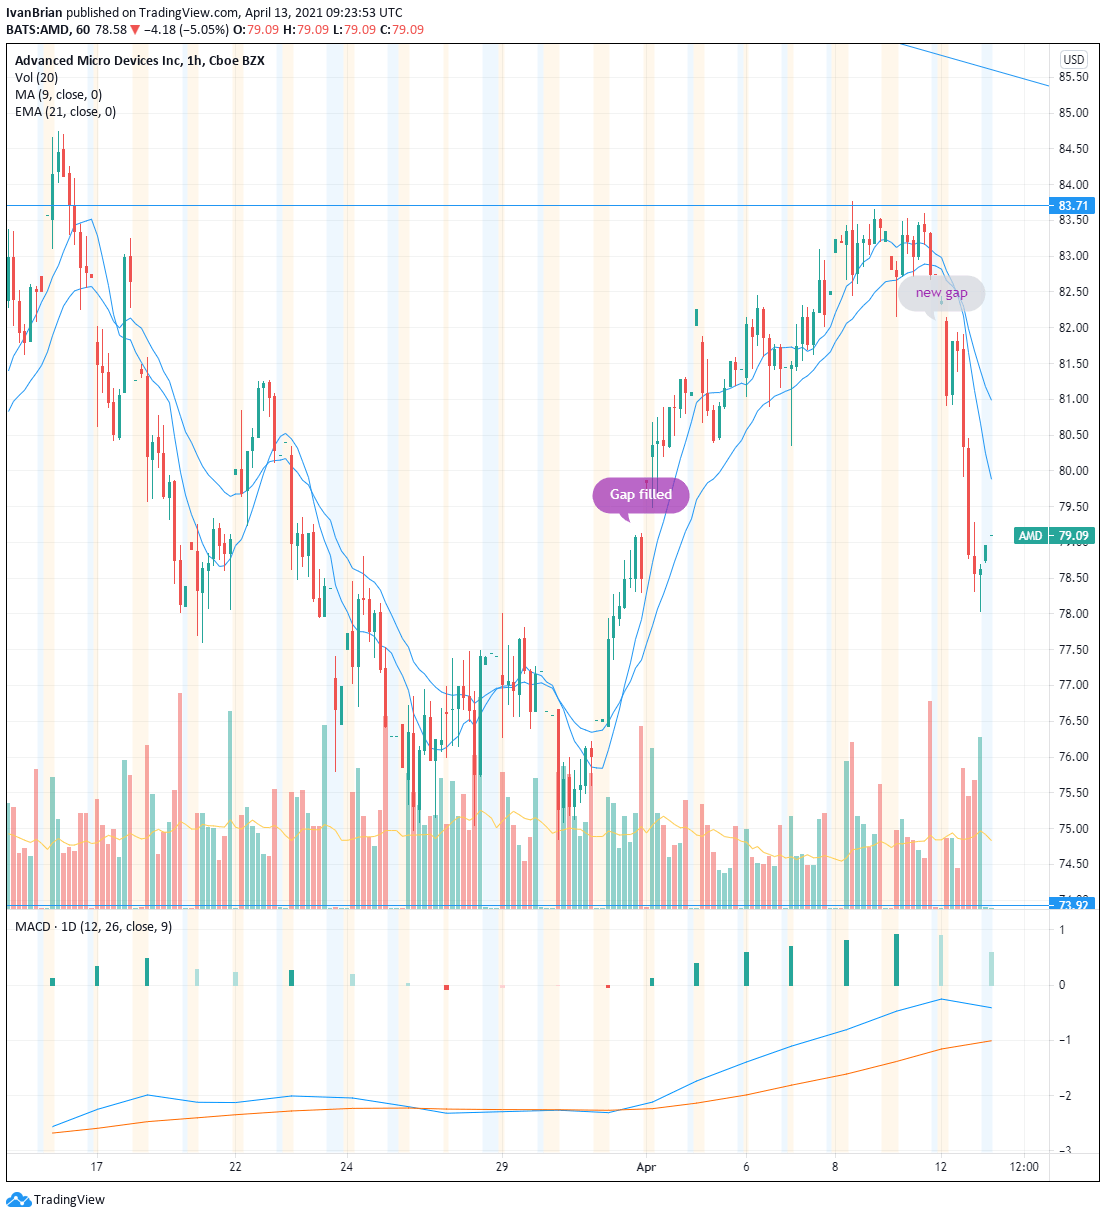
The hourly chart gives further clues. AMD has now filled the gap from March 31 to April 1. In the process, the stock has created a new gap up at the $82.10 to $82.50 level. Yesterday, toward the close, AMD put in a long shadow candle and closed up one dollar from the lows, so possibly this is some bargain hunters entering.
Nothing is yet strong enough to enter a new position. However, the bullish sentiment is stronger. Once or if the hourly short-term moving averages are retaken, look for the same to happen on the daily chart. This can be a catalyst to buy AMD. A breakout of $83.71 is another bullish signal.
If AMD fails and trades lower, then trading a breakout of the range at $73.92 would have a target of $71.63 (the gap from 28/29 July 2020) and then $62.33 (the gap from earlier in July 2020). Once or if AMD trades toward the $73.92 low of the current range, look for further indicators to decide whether to take long or short positions such as RSI, MACD, etc.
For now, the long-term trend is bullish and so is the broader market. It is always easier and safer to trade with the trend. This means that looking for levels and signals to go long is favoured.
At the time of writing, the author has no position in any stock mentioned in this article and no business relationship with any company mentioned. The author has not received compensation for writing this article, other than from FXStreet.
This article is for information purposes only. The author and FXStreet are not registered investment advisors and nothing in this article is intended to be investment advice. It is important to perform your own research before making any investment and take independent advice from a registered investment advisor.
FXStreet and the author do not provide personalized recommendations. The author makes no representations as to accuracy, completeness, or the suitability of this information. FXStreet and the author will not be liable for any errors, omissions or any losses, injuries or damages arising from this information and its display or use. The author will not be held responsible for information that is found at the end of links posted on this page.
Errors and omissions excepted.
Premium
You have reached your limit of 3 free articles for this month.
Start your subscription and get access to all our original articles.
Author

Ivan Brian
FXStreet
Ivan Brian started his career with AIB Bank in corporate finance and then worked for seven years at Baxter. He started as a macro analyst before becoming Head of Research and then CFO.