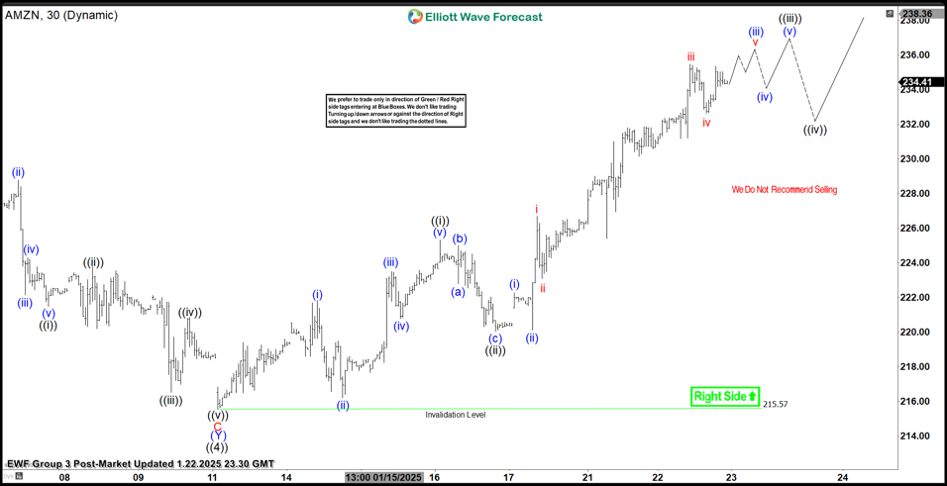
Short term Elliott Wave view in Amazon (AMZN) suggests rally to 233 on 12.16..2024 ended wave ((3)). The stock then pullback in wave ((4)) which unfolded as a double three Elliott Wave structure. Down from wave ((3)), wave (W) ended at 218.35 and wave (X) bounce ended at 230. Wave (Y) lower ended at 215.57 which completed wave ((4)) as the 30 minutes chart below shows.
The stock has resumed higher in wave ((5)). It has managed to break above wave ((3)) at 233 and made all-time high. This confirms the next leg higher has started and opens up short term bullish sequence. Up from wave ((4)), wave (i) ended at 221.82 and wave (ii) ended at 216.2. Wave (iii) higher ended at 223.44 and wave (iv) ended at 220.75. Final leg wave (v) ended at 225.31 which completed wave ((i))
The stock then corrected in wave ((ii)) at 220.01. The stock has resumed higher and soon should complete wave ((iii)). It will then pullback in wave ((iv)) before turning higher again in wave ((v)) to end wave 1. Near term, as far as pivot at 215.57 low stays intact, expect pullback to find support in 3, 7, 11 swing for more upside.
Amazon (AMZN) 30 minutes Elliott Wave chart
AMZN Elliott Wave [Video]
FURTHER DISCLOSURES AND DISCLAIMER CONCERNING RISK, RESPONSIBILITY AND LIABILITY Trading in the Foreign Exchange market is a challenging opportunity where above average returns are available for educated and experienced investors who are willing to take above average risk. However, before deciding to participate in Foreign Exchange (FX) trading, you should carefully consider your investment objectives, level of xperience and risk appetite. Do not invest or trade capital you cannot afford to lose. EME PROCESSING AND CONSULTING, LLC, THEIR REPRESENTATIVES, AND ANYONE WORKING FOR OR WITHIN WWW.ELLIOTTWAVE- FORECAST.COM is not responsible for any loss from any form of distributed advice, signal, analysis, or content. Again, we fully DISCLOSE to the Subscriber base that the Service as a whole, the individual Parties, Representatives, or owners shall not be liable to any and all Subscribers for any losses or damages as a result of any action taken by the Subscriber from any trade idea or signal posted on the website(s) distributed through any form of social-media, email, the website, and/or any other electronic, written, verbal, or future form of communication . All analysis, trading signals, trading recommendations, all charts, communicated interpretations of the wave counts, and all content from any media form produced by www.Elliottwave-forecast.com and/or the Representatives are solely the opinions and best efforts of the respective author(s). In general Forex instruments are highly leveraged, and traders can lose some or all of their initial margin funds. All content provided by www.Elliottwave-forecast.com is expressed in good faith and is intended to help Subscribers succeed in the marketplace, but it is never guaranteed. There is no “holy grail” to trading or forecasting the market and we are wrong sometimes like everyone else. Please understand and accept the risk involved when making any trading and/or investment decision. UNDERSTAND that all the content we provide is protected through copyright of EME PROCESSING AND CONSULTING, LLC. It is illegal to disseminate in any form of communication any part or all of our proprietary information without specific authorization. UNDERSTAND that you also agree to not allow persons that are not PAID SUBSCRIBERS to view any of the content not released publicly. IF YOU ARE FOUND TO BE IN VIOLATION OF THESE RESTRICTIONS you or your firm (as the Subscriber) will be charged fully with no discount for one year subscription to our Premium Plus Plan at $1,799.88 for EACH person or firm who received any of our content illegally through the respected intermediary’s (Subscriber in violation of terms) channel(s) of communication.
Recommended content
Editors’ Picks

EUR/USD hits two-week tops near 1.0500 on poor US Retail Sales
The selling pressure continues to hurt the US Dollar and now encourages EUR/USD to advance to new two-week peaks in levels just shy of the 1.0500 barrier in the wake of disappointing results from US Retail Sales.

GBP/USD surpasses 1.2600 on weaker US Dollar
GBP/USD extends its march north and reclaims the 1.2600 hurdle for the first time since December on the back of the increasing downward bias in the Greenback, particularly exacerbated following disheartening US results.

Gold maintains the bid tone near $2,940
The continuation of the offered stance in the Greenback coupled with declining US yields across the board underpin the extra rebound in Gold prices, which trade at shouting distance from their record highs.

Weekly wrap: XRP, Solana and Dogecoin lead altcoin gains on Friday
XRP, Solana (SOL) and Dogecoin (DOGE) gained 5.91%, 2.88% and 3.36% respectively on Friday. While Bitcoin (BTC) hovers around the $97,000 level, the three altcoins pave the way for recovery and rally in altcoins ranking within the top 50 cryptocurrencies by market capitalization on CoinGecko.

Tariffs likely to impart a modest stagflationary hit to the economy this year
The economic policies of the Trump administration are starting to take shape. President Trump has already announced the imposition of tariffs on some of America's trading partners, and we assume there will be more levies, which will be matched by foreign retaliation, in the coming quarters.

The Best Brokers of the Year
SPONSORED Explore top-quality choices worldwide and locally. Compare key features like spreads, leverage, and platforms. Find the right broker for your needs, whether trading CFDs, Forex pairs like EUR/USD, or commodities like Gold.