Alphabet Inc. ($GOOGL) found buyers at the blue box area as expected

In today’s article, we will look at the past performance of the 4H Hour Elliott Wave chart of Alphabet Inc. ($GOOGL). The rally from 10.27.2023 low at $120.25 unfolded as 5 waves impulse. So, we expected the pullback to unfold in 3 swings and find buyers again. We will explain the structure & forecast below:
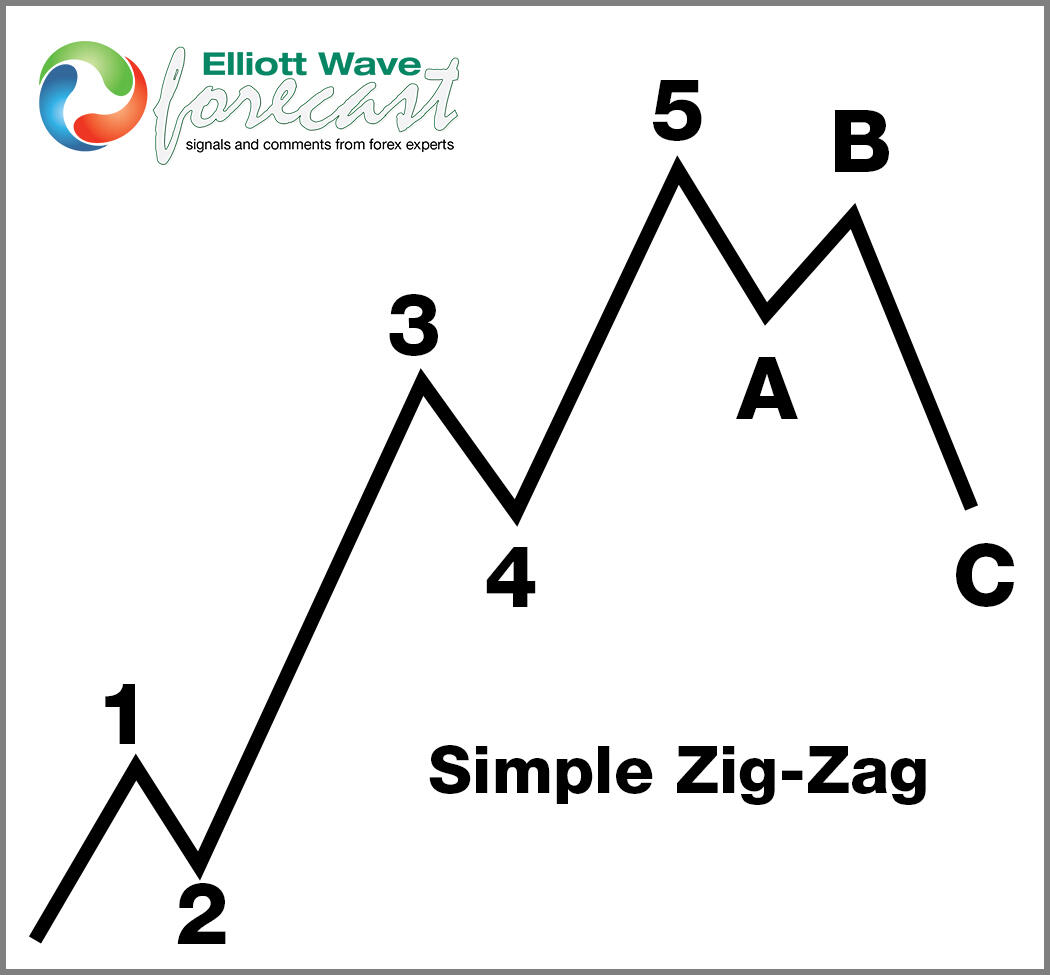
Five wave impulse structure + ABC correction
$GOOGL four-hour Elliott Wave chart 2.29.2024
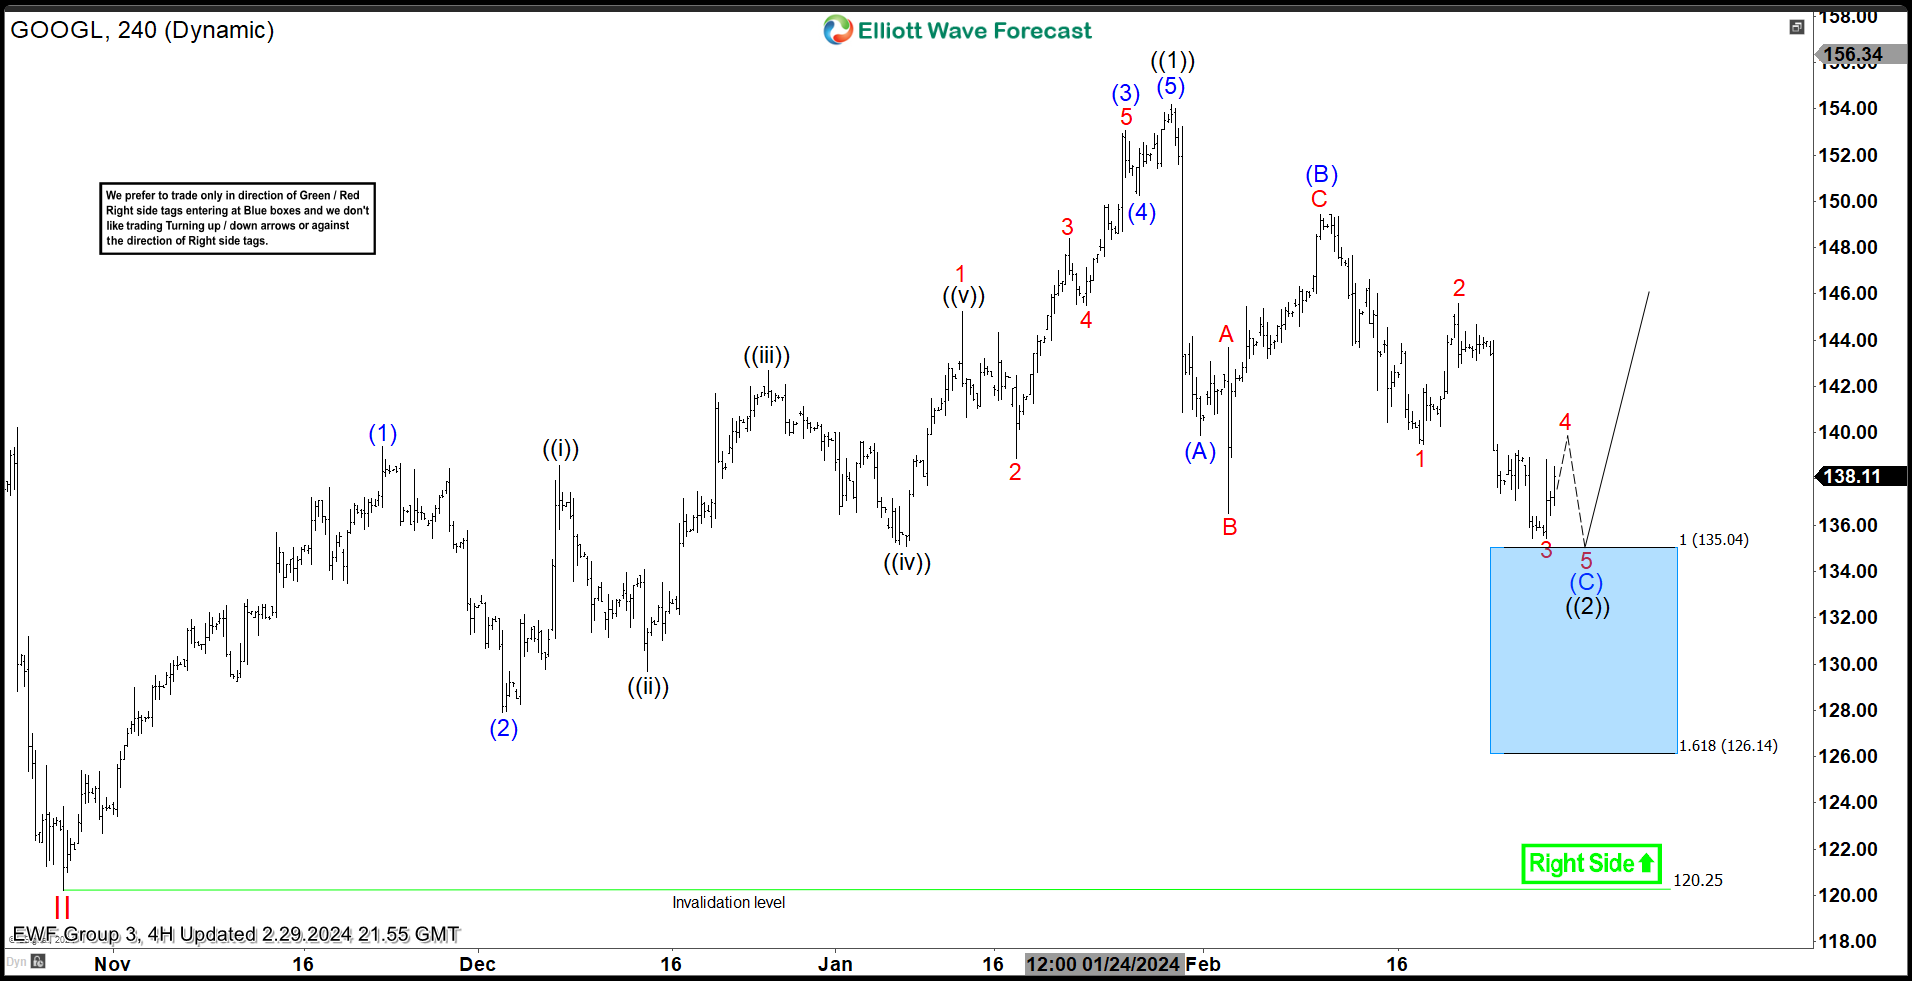
Here is the 4H Elliott Wave count from 2.29.2024. We expected the pullback to find buyers at the blue box area at 135.04 – 126.14 in 3 swings.
$GOOGL four-hour Elliott Wave chart 3.11.2024

Here is the latest 4H update from 3.10.2024 showing the bounce taking place as expected. The stock has reacted higher from the blue box area ending the 3 swings decline. The stock is expected to remain supported towards $142 – 145 where longs will be able to get risk free. A break above 1.29.2024 peak at 153.78 will open the next leg higher towards $164 – 185.
Author

Elliott Wave Forecast Team
ElliottWave-Forecast.com


