Alphabet (GOOGL Stock) bullish bounce at 50% Fib after ABC zigzag
-
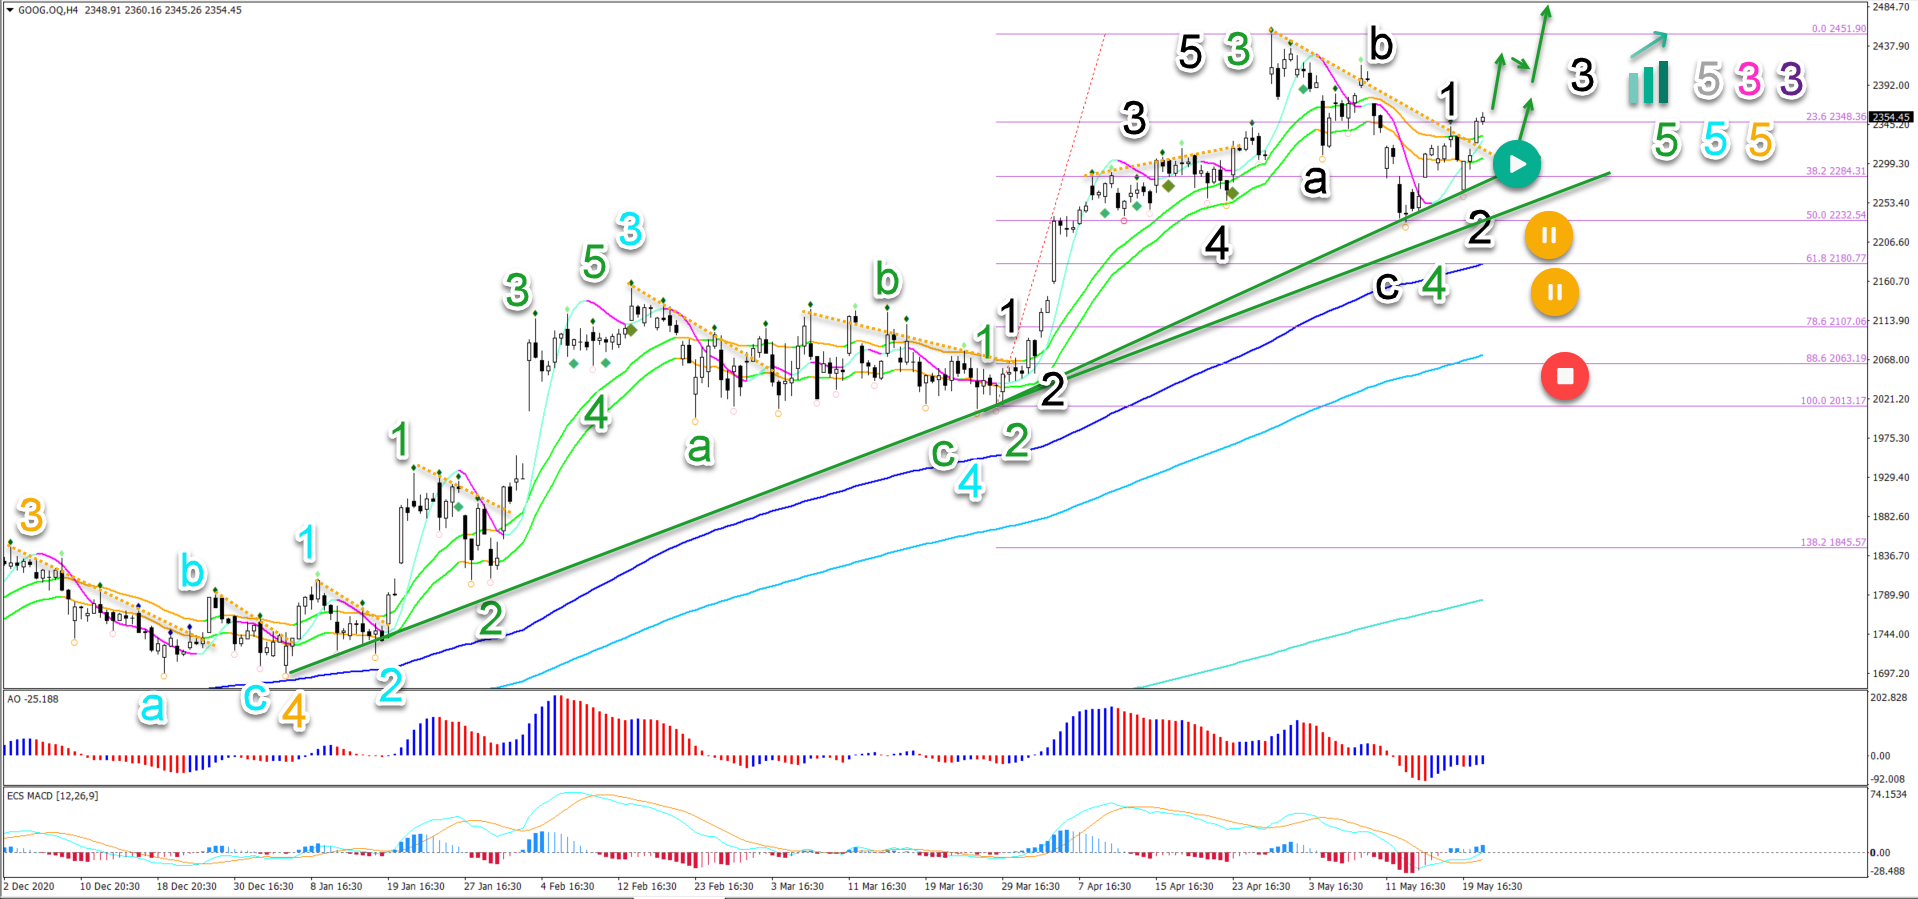
The GOOG uptrend remains strong as price action is above the 21 ema zone, which is above the long-term MAs. The current pullback is an interesting discount.
-
A bullish breakout (green arrows) could confirm the wave 3 (black) pattern. Breaks above the Fibonacci targets are further evidence of a wave 3 (black).
-
The current pullback seems to have completed a bearish ABC (black) pattern at the 50% Fibonacci retracement level within wave 4 (green).

The Alphabet stock (ticker GOOG) made a bullish continuation and reached the $2400 target zone as expected in our previous analysis.
This article offers a new update on the expected wave and chart patterns. We also review the key decision zones and new targets.
Price charts and technical analysis
The GOOG uptrend remains strong as price action is above the 21 ema zone, which is above the long-term moving averages. An uptrend channel is also visible (green lines). The current pullback could be an interesting discount within that trend. Let’s review:
-
The GOOG 4-hour chart made a bullish breakout after completing wave 4 (blue).
-
Then price action used the 21 ema zone for one more bullish push higher. This seems to have completed a 5 wave (black) pattern in wave 3 (green).
-
The current pullback seems to have completed a bearish ABC (black) pattern at the 50% Fibonacci retracement level within wave 4 (green).
-
Price action has broken above the resistance trend line (dotted orange) and the 21 ema zone. This could indicate a bullish 123 wave pattern (black).
-
The bullish wave outlook remains valid as long as price action stays above the 50% Fib. A break below it places this analysis on hold (orange circles) and a deep break invalidates it (red circle).
-
The bullish targets are located at the -27.2% Fibonacci target at $2751 and -61.8% Fibonacci target at $2723.
On the 4 hour chart, price action is testing a resistance zone (orange lines):
-
A bullish breakout (green arrows) could confirm the wave 3 (black) pattern. Breaks above the Fibonacci targets are further evidence of a wave 3 (black).
-
A bearish pullback (orange arrows) should test the support zone (green).
-
A bullish bounce (blue arrows) indicates that a wave 1-2 (brown) pattern is taking place in potential wave 3 (black).
-
A break below the support (green) places this outlook on hold (orange circle). A break below the bottom invalidates (red circle).

The analysis has been done with the ecs.SWAT method and ebook.
Author

Chris Svorcik
FS method
Chris Svorcik is a trader, analyst, and educator with over 15 years of experience in financial markets, specializing in moving averages, market structure, and price patterns.


