AIZ analysis: 10% rally from blue box – What’s next?

About AIZ
Assurant Inc. (NYSE: AIZ) is a leading global provider of risk management and insurance solutions, serving the housing and lifestyle markets. Headquartered in Atlanta, it operates across Global Housing and Global Lifestyle segments, offering products such as mobile device protection, vehicle service contracts, and renters insurance. With operations in over 20 countries, Assurant partners with major financial institutions and retailers, leveraging data-driven innovation to deliver consistent growth and strong shareholder value.
AIZ long-term Elliott Wave analysis – Weekly chart
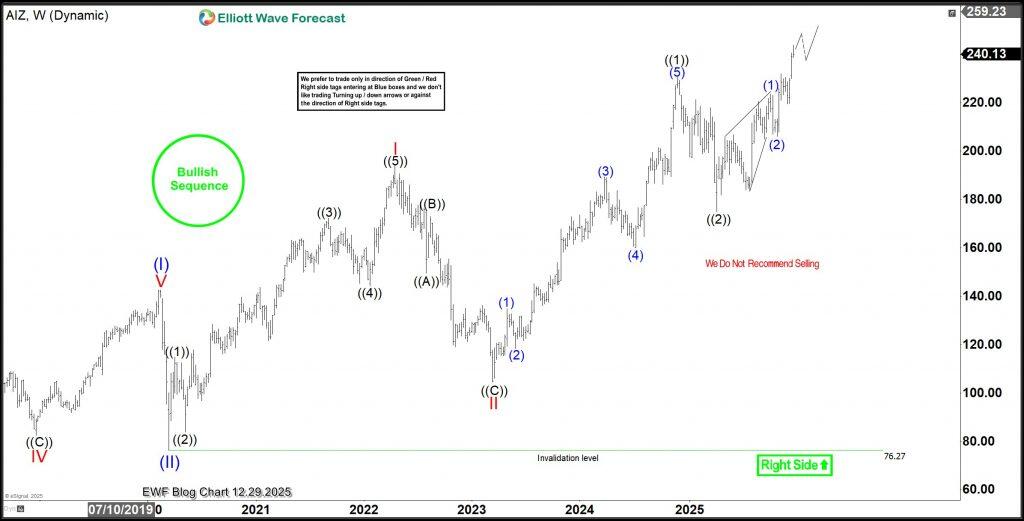
The all-time bullish cycle for AIZ began in November 2008 at $12.52. From that low, wave (I) advanced in a clear impulse and peaked in February 2020 at $146.21. It was followed by a sharp correction. Wave (II) ended in March 2020 at $76.26. From there, wave (III) is expected to extend higher, with an overall target between $287 and $417. Between March 2020 and April 2022, price completed another impulse. This move formed wave I of (III). After that, a 7-swing pullback formed wave ((2)). Buyers appeared in the blue box on the daily chart as shown in the 7th December update. With wave ((2)) complete, price resumed higher and broke above the wave (1) high first and then later wave ((1)) high. Consequently, wave ((3)) is now underway. This wave can target the $330–$380 area over the coming weeks or months.
AIZ trade setup –7th December 2025
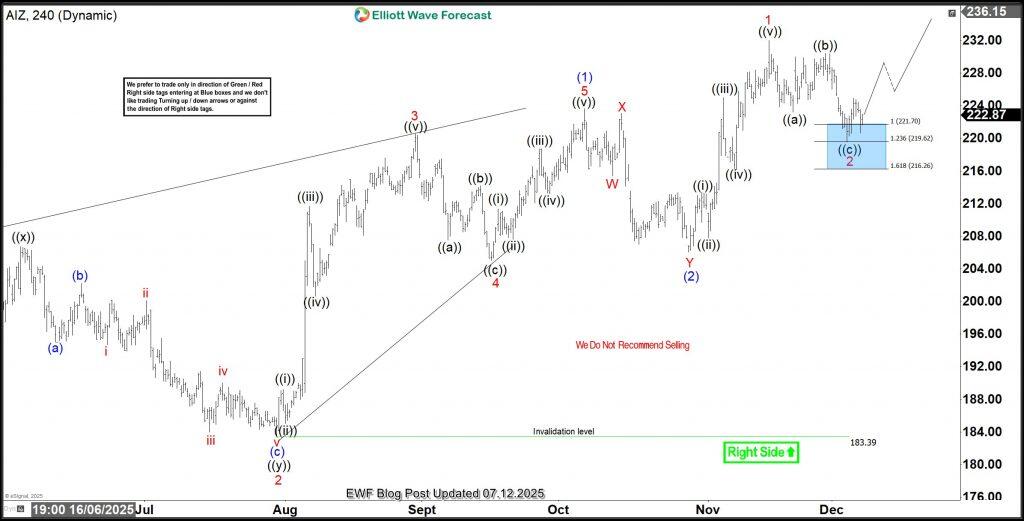
On 7th December, we shared the chart above. The chart shows the status of the pullback that followed shortly after price breached the top of wave (1) of ((3)). The pullback was for wave 2 of (3) and had just completed a 3-swing structure at the blue box. Thus, we recommended to readers to go long from the blue box.
AIZ trade setup –14th December 2025
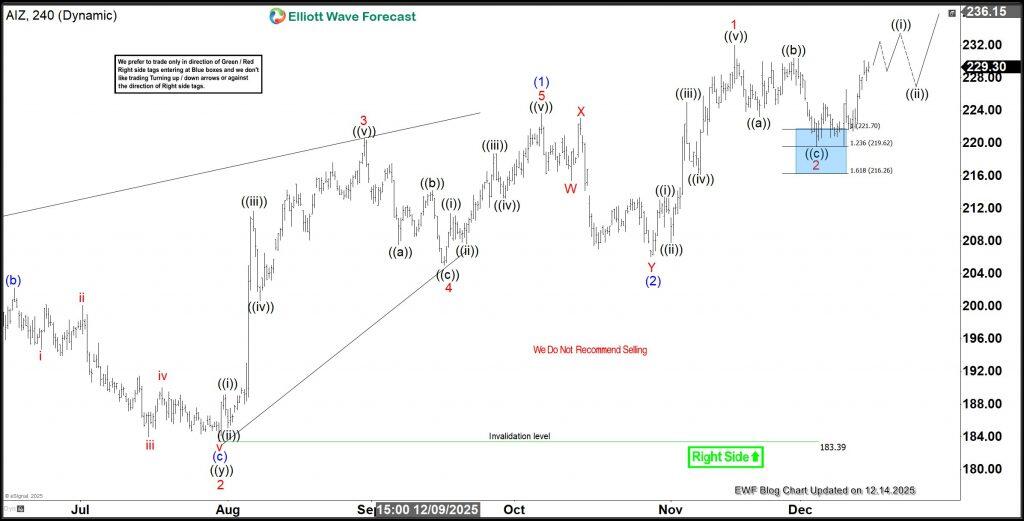
The chart above shows a swift reaction from the blue box as anticipated. With this move, traders closed half of the position in profit and then set rest to breakeven. In an ideal price action, Waves 3 extend to 1.618 x wave 1. In this case, we can anticipate wave 3 extending to $262. After this update, the stock broke upside in the next hours to establish wave 3 even stronger. The chart below shows the last chart and what we can expect next.
AIZ trade setup –29th December 2025
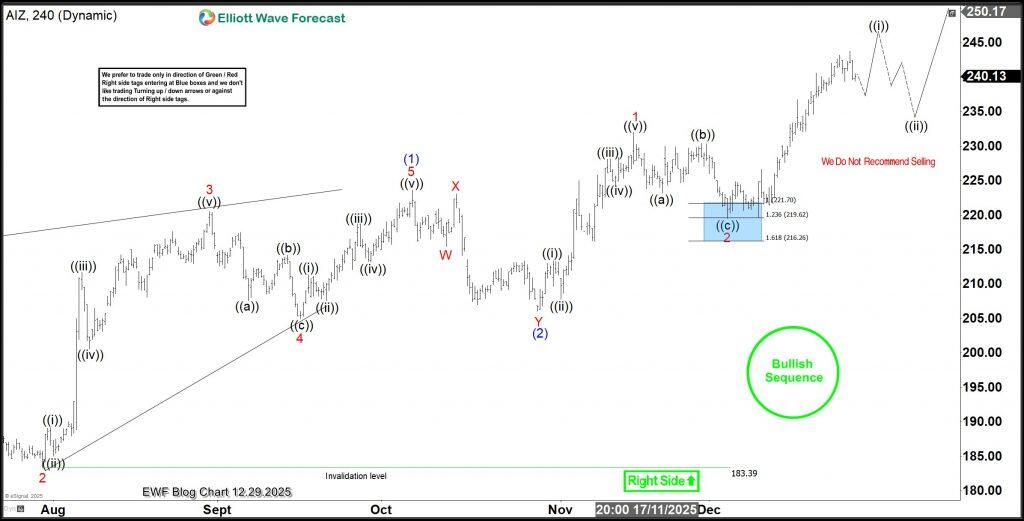
The rally from the blue box appears strong with no significant pullback. Thus, the anticipation for an extended wave 3 which could surpass the $260 target. Therefore, I labelled it as wave ((i)) of 3 which still needs one more leg at least, before completion. Whenever it finishes, a pullback will emerge for wave ((ii)) which will be attractive to buyers from the blue box. In a bullish sequence, buyers should take long positions from the dip. We provide trend analysis and sequence report for 78 instruments on all major time frames for our members. In addition, we provide the zone to buy or sell long-term
Author

Elliott Wave Forecast Team
ElliottWave-Forecast.com


