Advanced Micro Devices Stock News and Forecast: Why is AMD down after earnings beat estimates?
- AMD reported earnings after the close on Tuesday.
- Earnings per share and revenue both came in ahead of forecasts.
- The semiconductor manufacturer's shares are trading higher in Wednesday's premarket session.

Update: AMD shares are struggling to push on from a solid set of earnings. AMD released earnings after the close on Tuesday that were well ahead of expectations. Earnings per share (EPS) and revenue numbers both came in ahead of analyst estimates, but the shares are struggling to hold gains in early trading on Wednesday with AMD stock trading at $90.07 for a loss of 1%.
Advanced Micro Devices (AMD) reported strong earnings after the close on Tuesday, following on from the previous set of results back in April, which also were well ahead of estimates. This time it was the turn of Q2 2021 earnings that hit the tape. AMD reported earnings per share (EPS) of $0.63 versus the average Wall Street estimate of $0.54. Revenue was $3.85 billion versus the estimate for $3.62 billion. AMD also raised its full-year guidance for revenue growth from 50% to approximately 60%. AMD raised Q3 revenue guidance to $4.1 billion, while analysts have penciled in an average consensus of $3.8 billion.
Strong numbers to continue the strong performance and trend of recent quarters and AMD immediately jumped nearly 2% on the back of those numbers. At the time of writing, in Wednesday's premarket session, AMD stock is trading at $92.40 for a gain of 1.5%.
AMD is one of the largest semiconductor manufacturers in the world and is focused on the computing and graphics sector. Advanced Micro Devices is one of Intel's main competitors in the desktop and laptop chip market. The company's new Ryzen chips have become a serious option and challenge to Intel. The sector is the subject of much focus as numerous companies complain of semiconductor chip shortages. President Biden has set up a task force to help deal with global supply problems.
AMD key statistics
| Market Cap | $110.6 billion |
| Enterprise Value | $92.73 billion |
| Price/Earnings (P/E) | 39 |
|
Price/Book | 19 |
| Price/Sales | 11 |
| Gross Margin | 44% |
| Net Margin | 25% |
| EBITDA | $2.23 billion |
| Average Wall Street rating and price target |
Buy $109 |
From the table above, AMD shows gross margin at 44% but officials said in the post-earnings conference call that they expect gross margin to increase to 48%. Also, the average Wall Street analyst price target of $109 is likely to see considerable upgrades over the rest of the week as analysts rush to play catch up (they always seem to be behind the curve, but hey they get well paid). Interestingly, though, Bank of America is first out of the blocks and it has reduced AMD's price target from $74 to $72.
AMD stock forecast
AMD is clearly in a long-term bullish formation from the monthly chart below. But recently it has been trading in a wide range from $73 to $93 so is it now getting ready to break out? Well, Bank of America seems to think so but to the downside!
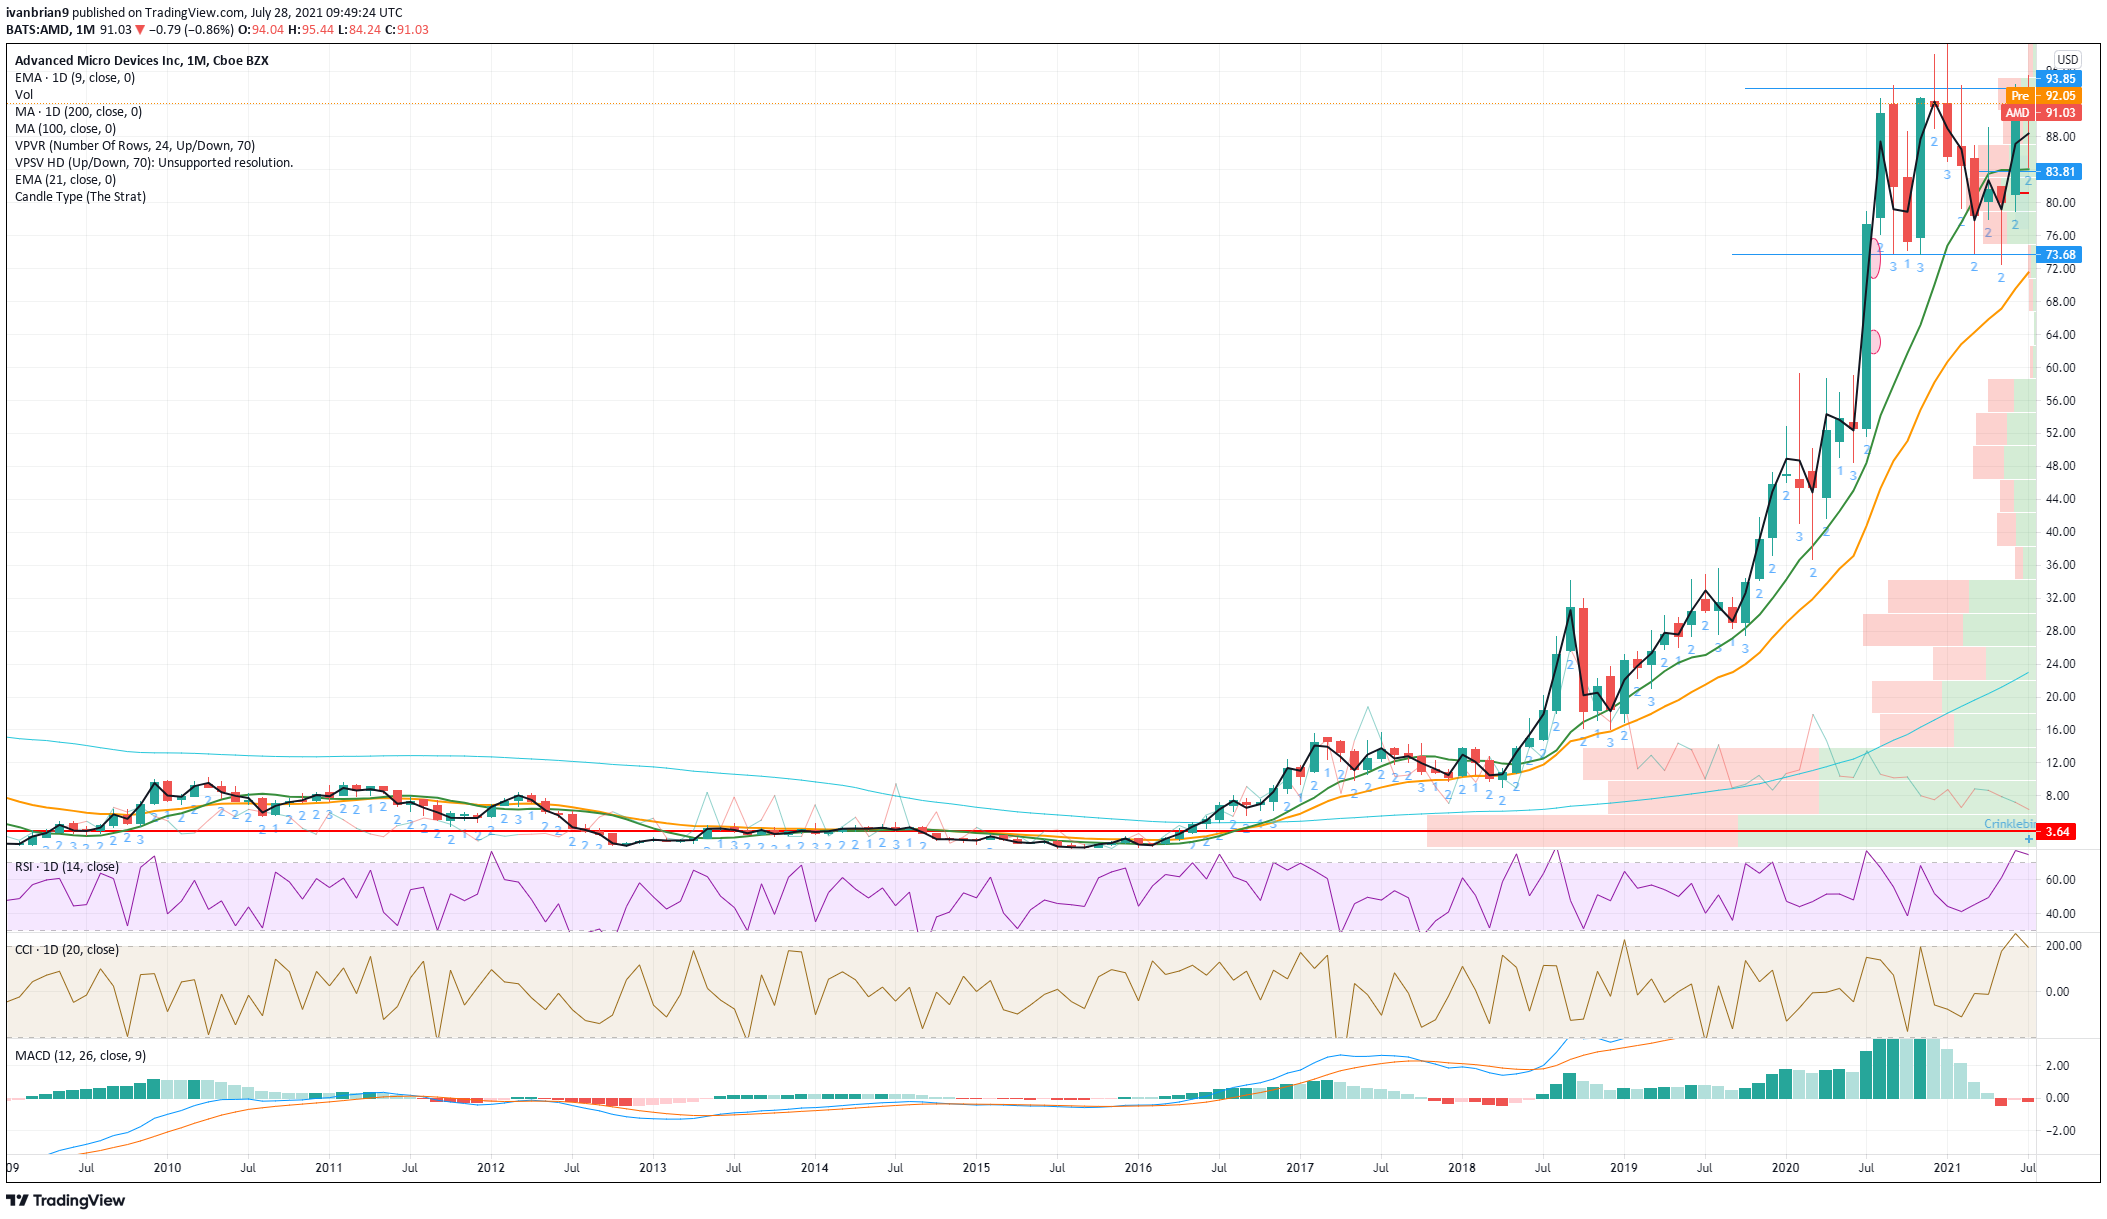
AMD monthly chart
From the daily chart below, there is a lot of sideways action and a large amount of volume at this wide range is why AMD shares have stabilized there. But above $96 volume thins out dramatically, so expect a break to accelerate there. This could be played by using a smart call option strategy. A price acceleration will see volatility pop as well as the price and so a $110 call option for example will rise considerably more than the underlying share price.
The move today in the regular session is key to future trend formation. The regular session and dark pool activity are where most of the big players get their work done not pre and post-market, that is retail territory. For now, the trend is looking good with AMD above the major moving averages and the RSI and CCI being neutral. The Moving Average Convergence Divergence (MACD) looks set to cross into a bullish move so keep an eye on this.
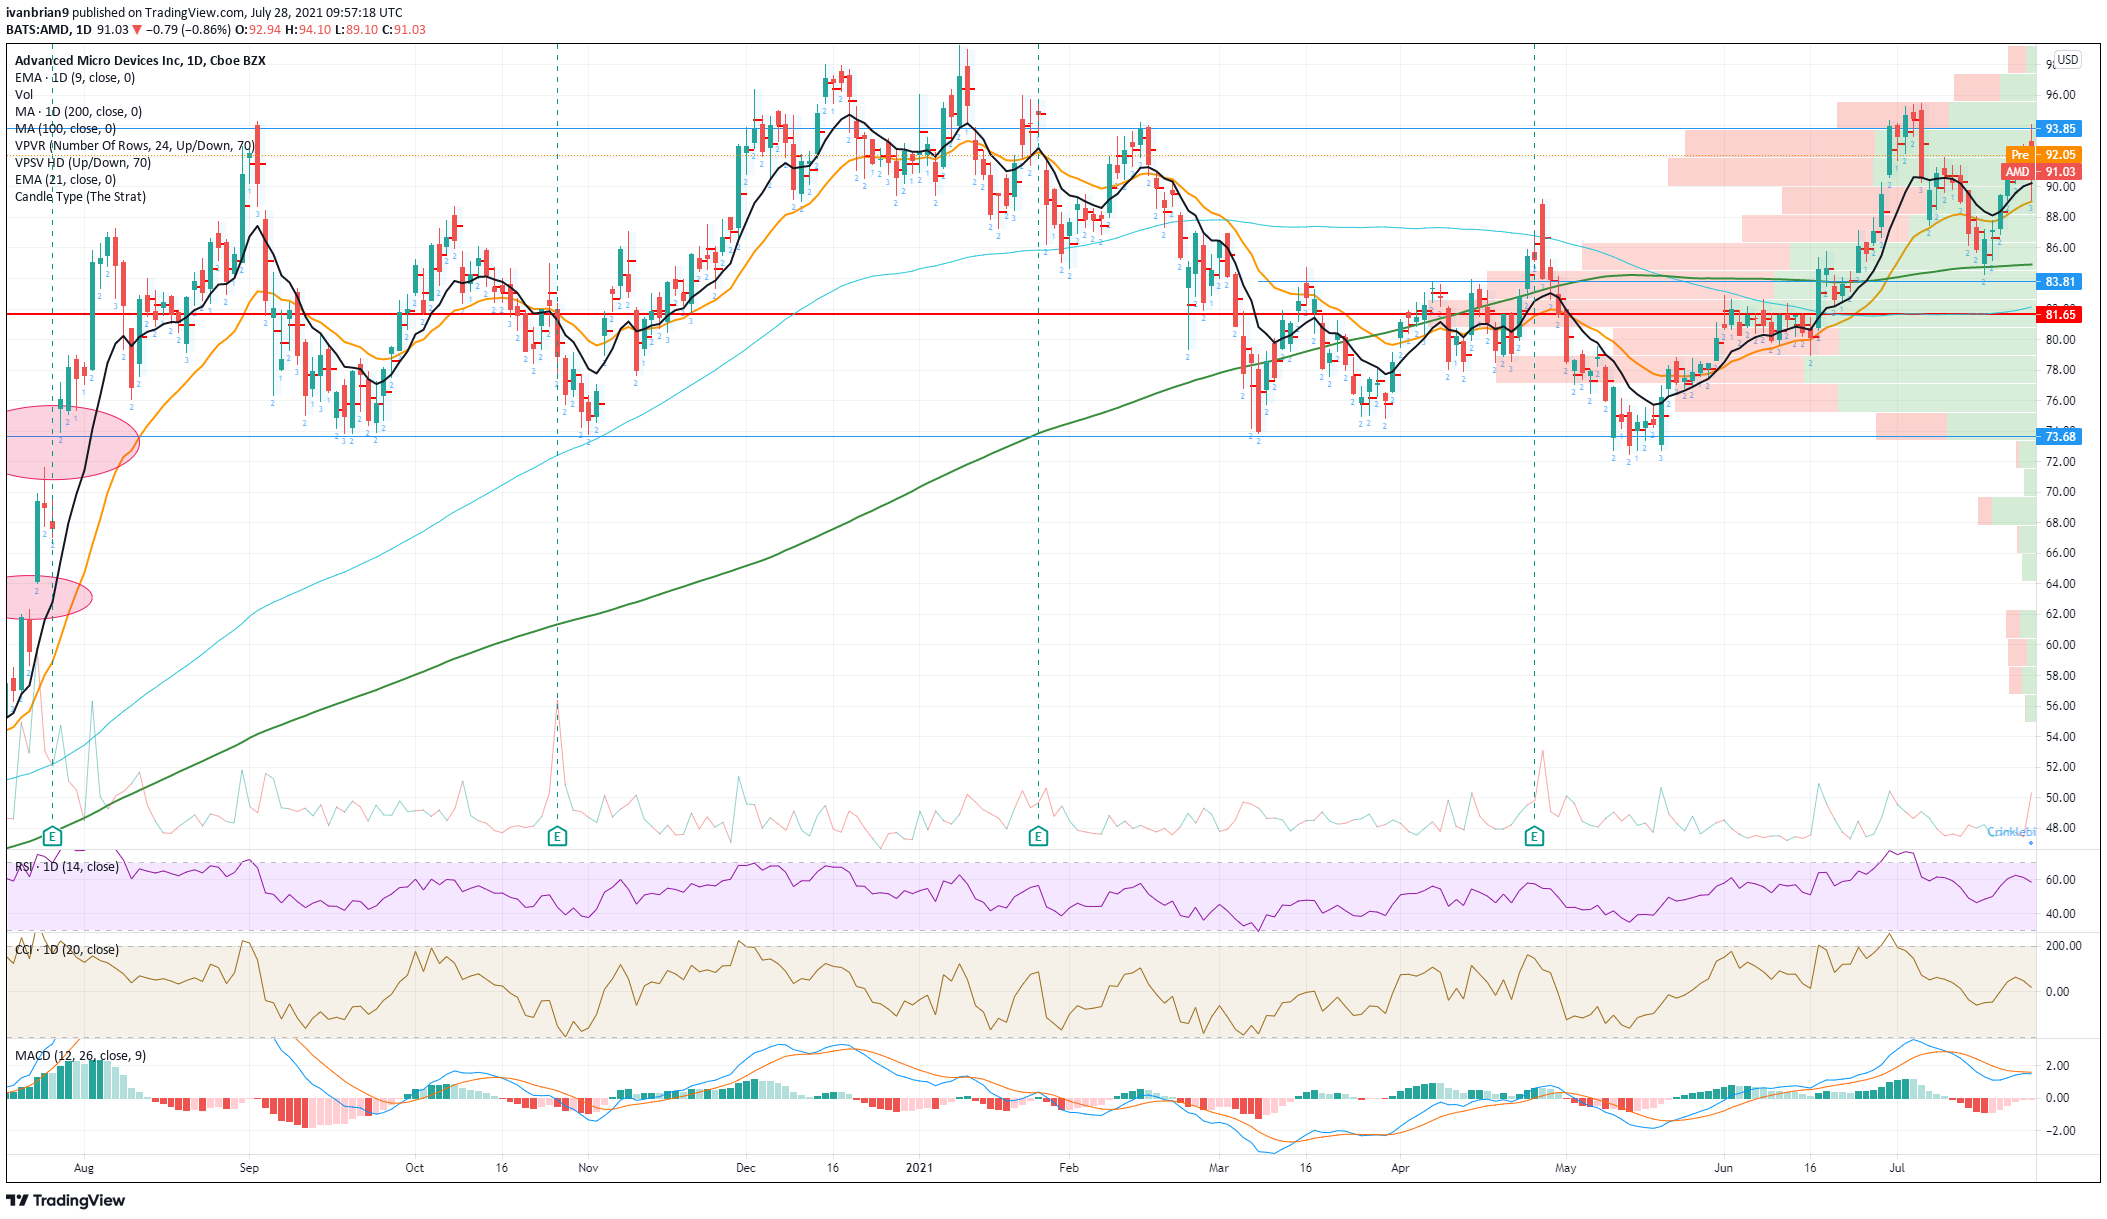
AMD daily chart
Like this article? Help us with some feedback by answering this survey:
Author

Ivan Brian
FXStreet
Ivan Brian started his career with AIB Bank in corporate finance and then worked for seven years at Baxter. He started as a macro analyst before becoming Head of Research and then CFO.