Breaking: US private sector payrolls decline 32,000 in September vs +50,000 forecast

Private sector employment in the US declined by 32,000 in September and annual pay was up 4.5% on a yearly basis, the Automatic Data Processing (ADP) reported on Wednesday. This reading followed the 3,000 decrease (revised from a 54,000 increase) reported in August and came in below the market expectation of 50,000.
Assessing the survey's findings, "despite the strong economic growth we saw in the second quarter, this month's release further validates what we've been seeing in the labor market, that US employers have been cautious with hiring,” said Nela Richardson, chief economist, ADP.
Market reaction to US ADP Employment Change
The US Dollar (USD) came under renewed selling pressure following the disappointing ADP Employment Change data. At the time of press, the USD Index was down 0.27% on the day at 97.53.
US Dollar Price Today
The table below shows the percentage change of US Dollar (USD) against listed major currencies today. US Dollar was the weakest against the Japanese Yen.
| USD | EUR | GBP | JPY | CAD | AUD | NZD | CHF | |
|---|---|---|---|---|---|---|---|---|
| USD | -0.21% | -0.50% | -0.78% | 0.00% | -0.20% | -0.55% | 0.04% | |
| EUR | 0.21% | -0.27% | -0.62% | 0.21% | 0.03% | -0.32% | 0.25% | |
| GBP | 0.50% | 0.27% | -0.28% | 0.49% | 0.31% | -0.04% | 0.52% | |
| JPY | 0.78% | 0.62% | 0.28% | 0.83% | 0.58% | 0.48% | 0.93% | |
| CAD | -0.01% | -0.21% | -0.49% | -0.83% | -0.21% | -0.54% | 0.03% | |
| AUD | 0.20% | -0.03% | -0.31% | -0.58% | 0.21% | -0.35% | 0.22% | |
| NZD | 0.55% | 0.32% | 0.04% | -0.48% | 0.54% | 0.35% | 0.57% | |
| CHF | -0.04% | -0.25% | -0.52% | -0.93% | -0.03% | -0.22% | -0.57% |
The heat map shows percentage changes of major currencies against each other. The base currency is picked from the left column, while the quote currency is picked from the top row. For example, if you pick the US Dollar from the left column and move along the horizontal line to the Japanese Yen, the percentage change displayed in the box will represent USD (base)/JPY (quote).
This section below was published as a preview of the ADP Employment Change at 07:00 GMT.
- September’s ADP figures are expected to confirm that employment growth has stalled in the US.
- The US private sector is expected to have added 50K new payrolls in August.
- The US Dollar remains vulnerable as investors anticipate a series of Fed rate cuts.
Heading into the first week of the month, the focus shifts to US employment figures, looking for further clues of the Federal Reserve’s (Fed) interest rate path. On Wednesday, at 12:15 GMT, Automatic Data Processing Inc. (ADP), the largest payroll processor in the US, is set to release the ADP Employment Change report for September, measuring the change in the number of people privately employed in the US.
Recent employment reports have raised the alarm bell, pointing to an economic slowdown and putting into question the theory of US economic exceptionalism. In that sense, Wednesday’s figures, except for a surprise performance, are unlikely to calm those fears.
The ADP report is likely to gather particular interest. A highly likely shutdown of the US Government is threatening to delay the release of Friday’s all-important Nonfarm Payrolls (NFP) report, leaving Wednesday’s data as the last employment gauge ahead of the Fed’s monetary policy meeting in late October.
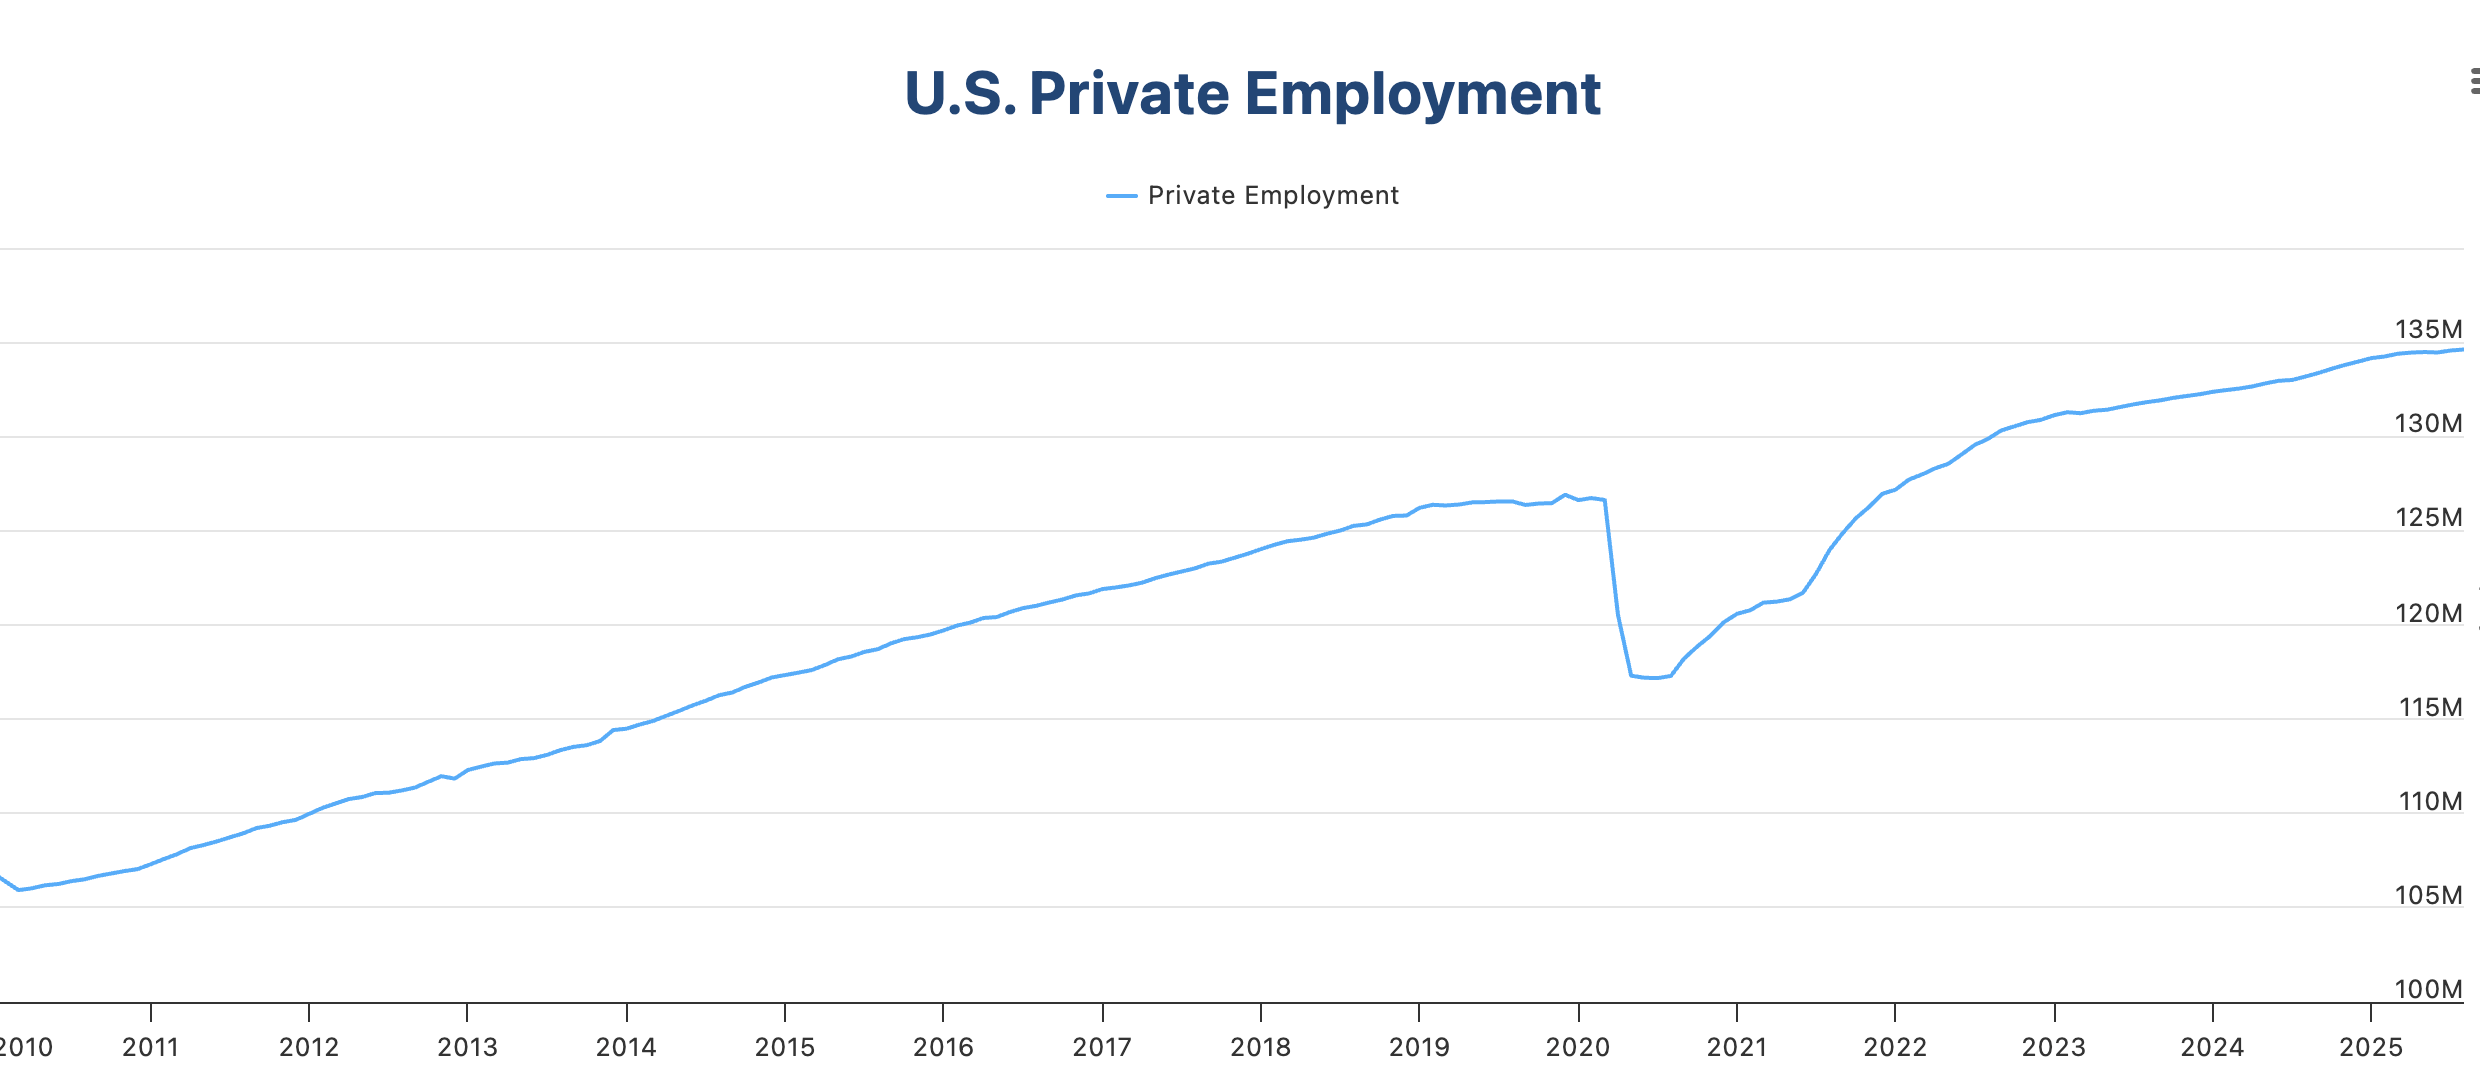
Labour market figures are likely to support further easing in October
Employment is a key element of the Fed’s dual mandate, in conjunction with price stability. Recent data revealed that price pressures remained at relatively moderate levels in August, in contrast with employment growth, which has plummeted in the second half of the year.
US Nonfarm Payrolls disappointed in August with a mere 22K increase, against market expectations of a 75K increment. Beyond that, the Unemployment Rate increased to 4.3%, its highest level in four years, confirming a significant deterioration of the labour market.
On Tuesday, US JOLTS Job openings were slightly better than expected; however, September’s ADP Employment Change report is expected to add to evidence of a weakening labour market. This will likely provide further arguments for Fed doves, as well as from US President Donald Trump, who has been pushing for a more aggressive monetary easing cycle for months.
The US central bank cut rates by 25 basis points in September for the first time this year and hinted at further interest rate cuts in the near term. Fed Chairman Jerome Powell and other policymakers have reiterated the need to tread cautiously amid the upside risks to inflation, but further evidence of a loosening labour market might put pressure on the bank to ease its monetary policy further.
Financial markets are nearly fully pricing a rate cut in late October. The CME Group’s Fed Watch tool is pricing in a 90% chance of a quarter-point easing move in October, although the odds for another such cut in December have eased to 70% from 75% a week ago. September’s ADP report might give a further boost to those hopes.
When will the ADP report be released, and how could it affect the US Dollar Index
The ADP Employment Change report for September is set to be released on Wednesday at 12:15 GMT. The market consensus points to 50K new jobs following a 54K increase in July. All in all, numbers are well below the above-100K average seen last year and in the first half of 2025.
The US Dollar Index (DXY), which measures the value of the Greenback against a basket of major currencies, has depreciated nearly 1% since the release of a moderate US Personal Consumption Expenditures (PCE) Price Index on Friday, and amid investors' concerns about the consequences of a US government shutdown.
With this in mind, the US Dollar is likely to be more vulnerable to a weak ADP employment report, adding to evidence that the US economy needs a further boost from lower borrowing costs. A positive surprise, on the other hand, might ease bearish pressure on the Greenback, but a significant recovery seems unlikely given the uncertain political context.
US Dollar Index 4-Hour Chart
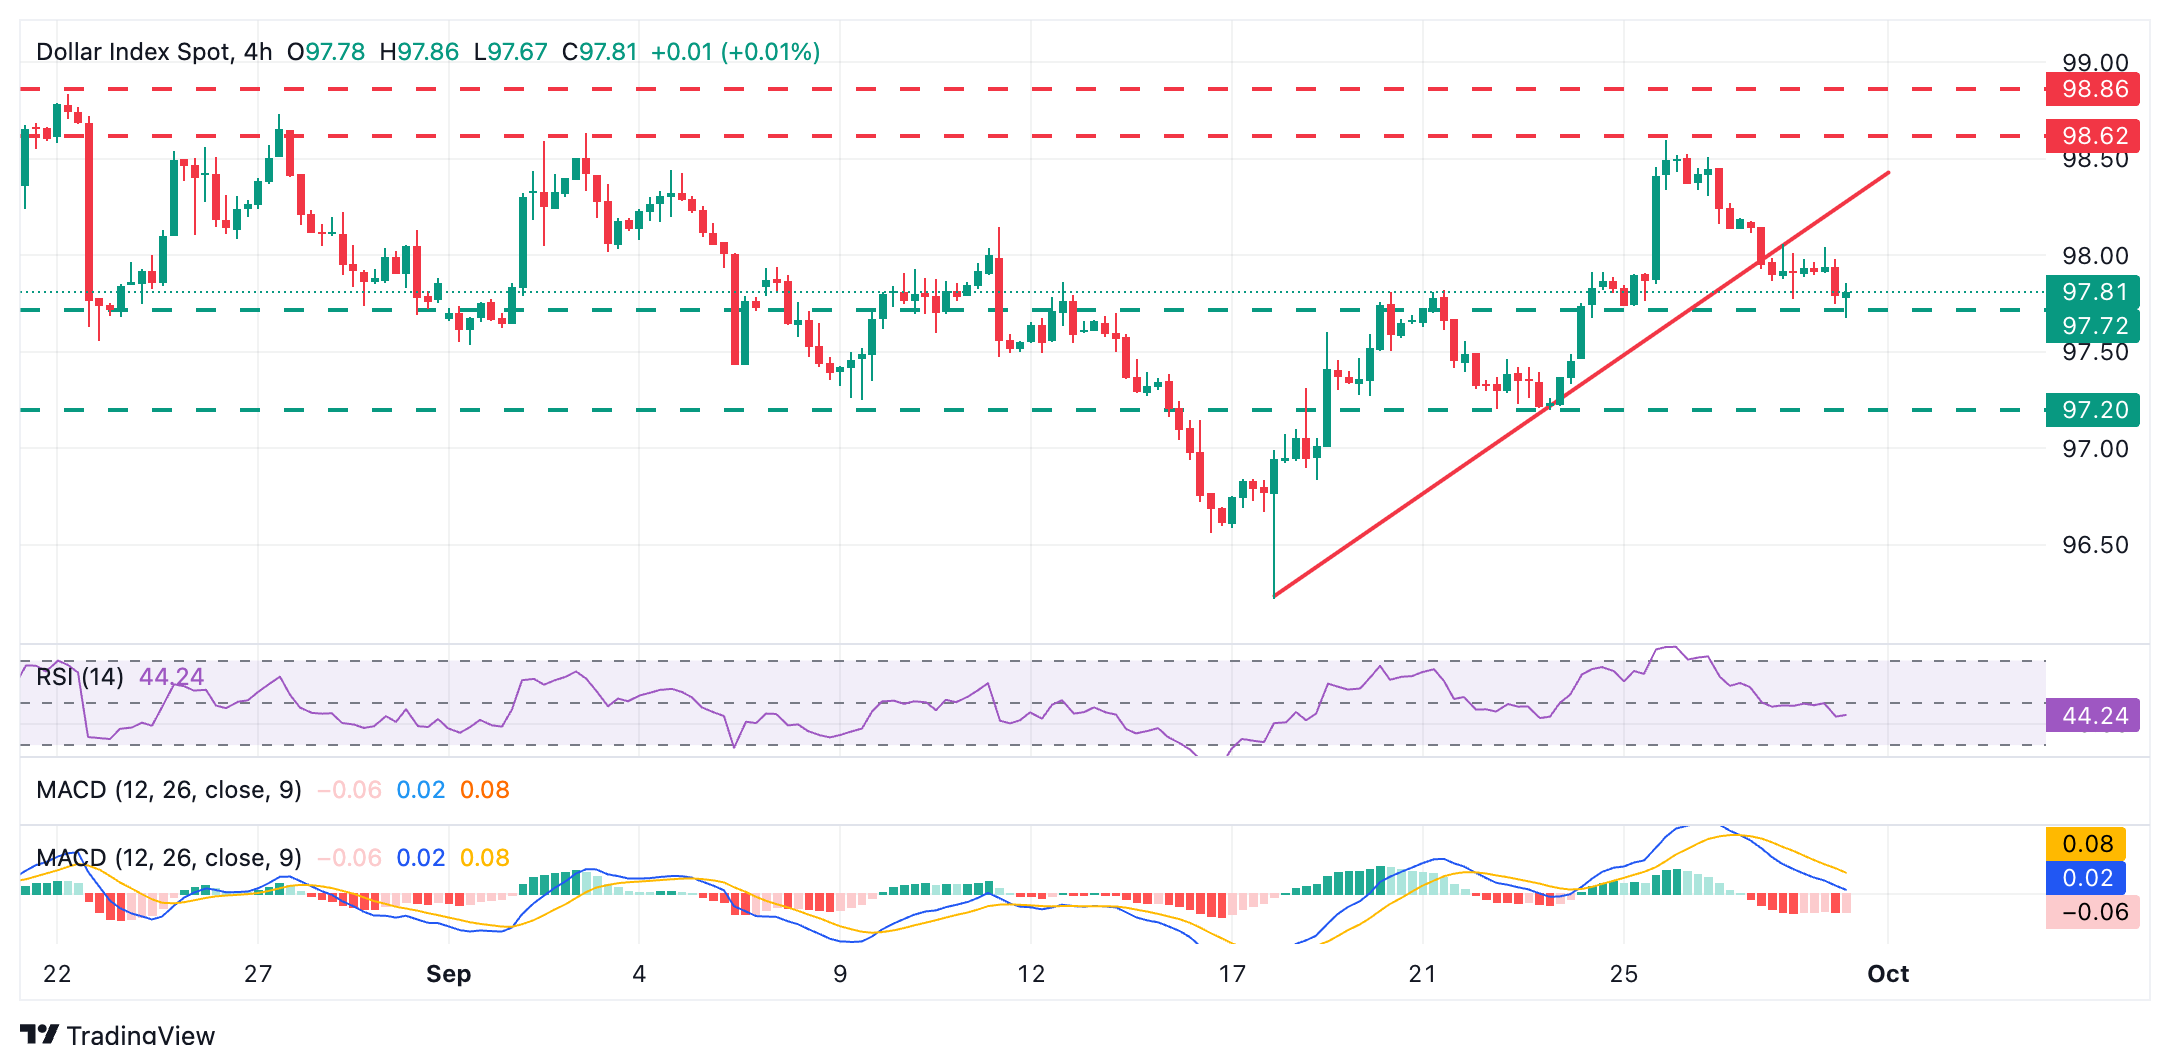
From a technical perspective, Guillermo Alcalá, FX analyst at FXStreet.com, sees the US Dollar Index (DXY) under growing bearish pressure after breaking and confirming below the trendline support from mid-September lows, with the 4-hour Relative Strength Index (RSI) and the Moving Average Convergence Divergence (MACD), both dipping further into negative territory.
According to Alcalá, “The area between the September 19 and 22 highs and September 25 lows, near 97.70, is holding bears for now ahead of the September 23 lows, at around 97.15, and the key support area, the four-year low, at 96.22, hit on September 17.”
To the upside, Alcalá sees immediate resistance at a reverse broken trendline “now around 98.15, that needs to be breached to ease bearish pressure and shift the focus towards the September 25 high, at 98.60, and higher.”
US Dollar FAQs
The US Dollar (USD) is the official currency of the United States of America, and the ‘de facto’ currency of a significant number of other countries where it is found in circulation alongside local notes. It is the most heavily traded currency in the world, accounting for over 88% of all global foreign exchange turnover, or an average of $6.6 trillion in transactions per day, according to data from 2022. Following the second world war, the USD took over from the British Pound as the world’s reserve currency. For most of its history, the US Dollar was backed by Gold, until the Bretton Woods Agreement in 1971 when the Gold Standard went away.
The most important single factor impacting on the value of the US Dollar is monetary policy, which is shaped by the Federal Reserve (Fed). The Fed has two mandates: to achieve price stability (control inflation) and foster full employment. Its primary tool to achieve these two goals is by adjusting interest rates. When prices are rising too quickly and inflation is above the Fed’s 2% target, the Fed will raise rates, which helps the USD value. When inflation falls below 2% or the Unemployment Rate is too high, the Fed may lower interest rates, which weighs on the Greenback.
In extreme situations, the Federal Reserve can also print more Dollars and enact quantitative easing (QE). QE is the process by which the Fed substantially increases the flow of credit in a stuck financial system. It is a non-standard policy measure used when credit has dried up because banks will not lend to each other (out of the fear of counterparty default). It is a last resort when simply lowering interest rates is unlikely to achieve the necessary result. It was the Fed’s weapon of choice to combat the credit crunch that occurred during the Great Financial Crisis in 2008. It involves the Fed printing more Dollars and using them to buy US government bonds predominantly from financial institutions. QE usually leads to a weaker US Dollar.
Quantitative tightening (QT) is the reverse process whereby the Federal Reserve stops buying bonds from financial institutions and does not reinvest the principal from the bonds it holds maturing in new purchases. It is usually positive for the US Dollar.
Author

FXStreet Team
FXStreet
Composed of a group of economic journalists and FX experts, the FXStreet content team produces and oversees all content published on FXStreet. It provides a purely journalistic approach to the Forex market.