Adani Green Indian stocks Elliott Wave technical analysis [Video]
![Adani Green Indian stocks Elliott Wave technical analysis [Video]](https://editorial.fxsstatic.com/images/i/india-01_XtraLarge.jpg)
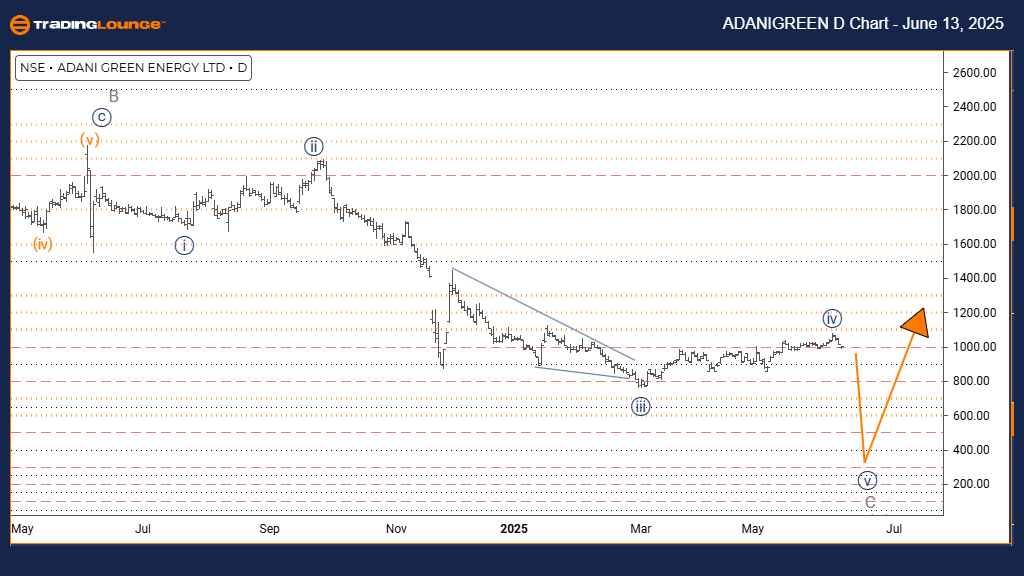
ADANI GREEN Elliott Wave analysis – Day chart
Function: Counter Trend.
Mode: Impulsive.
Structure: Navy blue wave 5.
Position: Gray wave C.
Direction next lower degrees: Navy blue wave 5 (in progress).
Details: Navy blue wave 4 appears complete, initiating navy blue wave 5.
Wave cancel invalid level: 1592.
The daily Elliott Wave analysis for ADANI GREEN highlights a counter-trend formation within an impulsive mode, signaling robust price action against the prevailing trend. The current structure represents navy blue wave 5, positioned inside a broader corrective move, gray wave C. This suggests the market is likely progressing through the final phase of the correction.
Wave analysis indicates that navy blue wave 4 has completed, with the chart now transitioning into navy blue wave 5. This wave often signals the final leg in a counter-trend cycle and is typically characterized by sharp momentum in the opposite direction of the main trend. As per the wave count, this impulsive move in wave 5 has already started.
Traders should monitor the critical wave invalidation level at 1592. A price move above this level would invalidate the current wave structure and necessitate a revised market outlook. Until this point is breached, the analysis continues to support the existing counter-trend interpretation.
Technically, ADANI GREEN appears poised for a concluding counter-trend movement, with the initiation of navy blue wave 5 confirming the completion of wave 4. This move suggests intensified selling pressure, though caution is advised for reversal signals, as this wave completes the broader gray wave C correction.
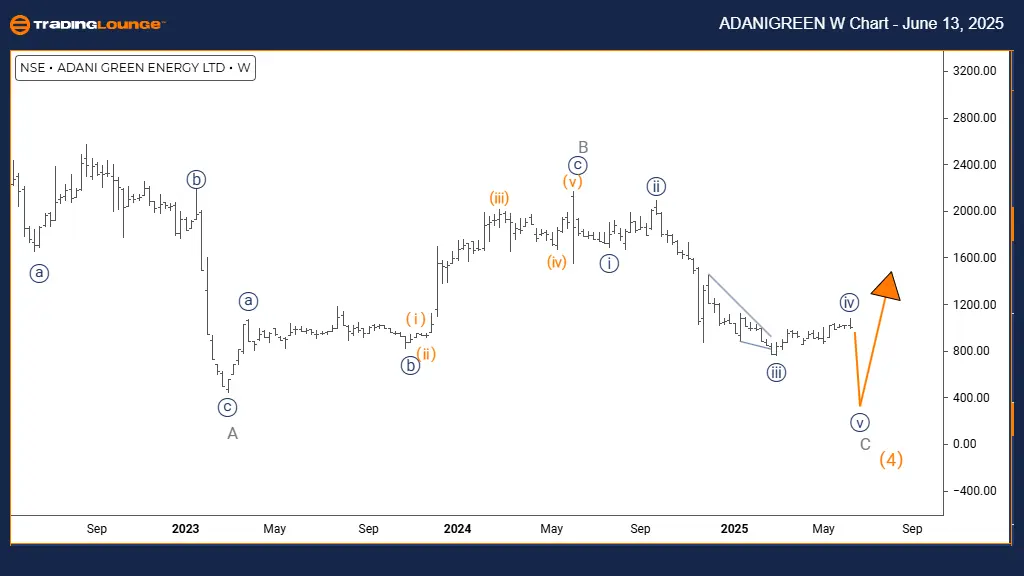
ADANI GREEN Elliott Wave analysis – Weekly chart
Function: Counter Trend.
Mode: Impulsive.
Structure: Gray wave C.
Position: Orange wave 4.
Direction next higher degrees: Orange wave 5.
Detalis: Gray wave B appears complete, initiating gray wave C.
Wave cancel invalid level: 1592.
The weekly Elliott Wave analysis for ADANI GREEN outlines a counter-trend setup with impulsive price movement, indicating strong action against the prevailing trend. The ongoing wave structure, gray wave C, is part of a larger correction within orange wave 4, suggesting that the stock is entering the final stages of this corrective sequence.
The completion of gray wave B has led into the active phase of gray wave C, which is usually the final leg in a corrective pattern. This wave often reflects intensified momentum in the direction opposite to the main trend. Following this, orange wave 5 is expected to emerge, signaling a likely continuation of the primary trend once the correction concludes.
The key level to watch remains the wave invalidation point at 1592. A price rise beyond this level would nullify the current wave count and require a revised analysis. Until this threshold is breached, the chart structure supports the ongoing counter-trend move.
Currently, ADANI GREEN appears to be in the final phase of its corrective pattern, with gray wave C now in motion after the end of gray wave B. The impulsive behavior of this wave hints at significant selling pressure, but traders should remain cautious and observe for signs indicating the completion of the corrective structure tied to orange wave 4.
Adani Green Indian stocks Elliott Wave technical analysis [Video]
Author

Peter Mathers
TradingLounge
Peter Mathers started actively trading in 1982. He began his career at Hoei and Shoin, a Japanese futures trading company.


