Adani Green Energy stocks Elliott Wave technical analysis [Video]
![Adani Green Energy stocks Elliott Wave technical analysis [Video]](https://editorial.fxstreet.com/images/Markets/Equities/Industries/EnergyStocks/electric-power-637435385712017394_XtraLarge.jpg)
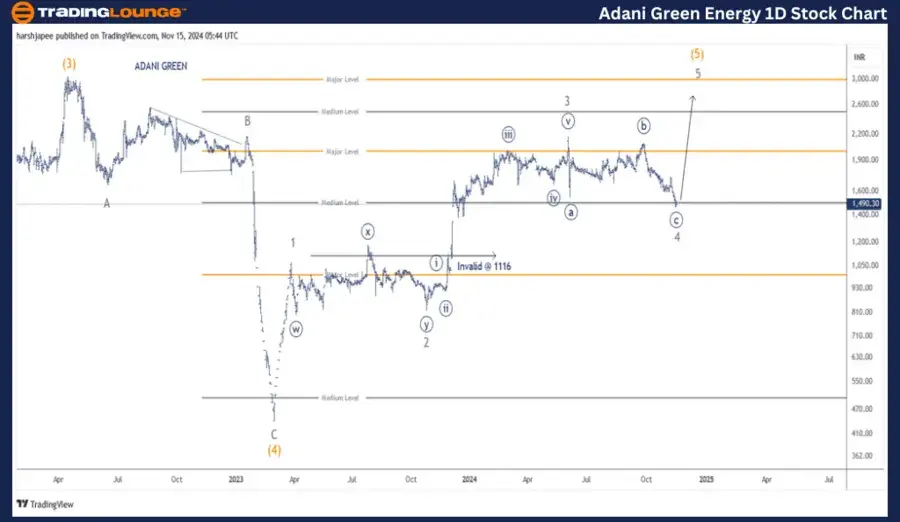
Adani Green Energy – Adanigreen (one-day chart) Elliott Wave technical analysis
Function: Larger Degree Trend Higher (Intermediate degree, orange).
Mode: Motive.
Structure: Impulse.
Position: Minor Wave 4 Grey.
Details: The counts have been adjusted with potential termination of Minor Wave 4 Grey 1485-90 zone. If correct, Minor Wave 5 Grey should resume higher soon, within Intermediate Wave (5). Alternatively, a continued drag lower would indicate a larger degree correction is underway.
Invalidation point: 1116.
ADANI GREEN ENERGY Daily Chart Technical Analysis and potential Elliott Wave Counts:
ADANI GREEN ENERGY daily chart indicating a progressive rally, which is within its last leg Minor Wave 5 Grey of Intermediate Wave (5) Orange against 1480 and broadly against 1116 low. Immediate resistance is seen around 1750 and a break higher would confirm a bottom in place.
The stock terminated Intermediate Wave (4) Orange around 435 mark on February 2023. Since then the rally has completed Minor Wave 1 (1075), Wave 2 (824), Wave 3 (2170) and potential Wave 4 around 1480 mark.
If the above is correct, bulls should be back in control soon from current price at 1490 levels as Minor Wave 5 unfolds.
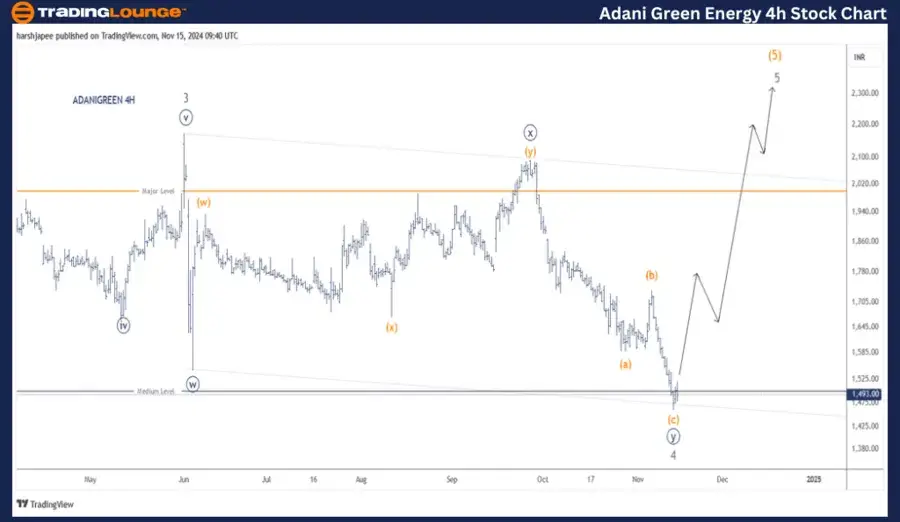
Adani Green Energy – Adanigreen (four-hour chart) Elliott Wave technical analysis
Function: Larger Degree Trend Higher (Intermediate degree, orange).
Mode: Motive.
Structure: Impulse.
Position: Minor Wave 4 Grey.
Details: The counts have been adjusted with potential termination of Minor Wave 4 Grey around 1485-90 zone. If correct, Minor Wave 5 Grey should resume higher soon, within Intermediate Wave (5). A break above 1735 will confirm bulls are back in control. Alternatively, a continued drag lower would indicate a larger degree correction is underway.
Invalidation point: 1116.
ADANI GREEN ENERGY 4H Chart Technical Analysis and potential Elliott Wave Counts:
ADANI GREEN ENERGY 4H chart is highlighting the sub waves between Minor Wave 3 and 4. The Minute Wave structure has been adjusted to ((w))-((x))-((y)), which looks complete around 1480-90 range. Also note the channel support has been tested.
If the above holds true, the stock should turn higher from here against 1480 low.
Conclusion:
ADANI GREEN ENERGY could be progressing higher from here (1490), as Minor Wave 5 begins to unfold within Intermediate Wave (5) Orange.
Elliott Wave analyst: Harsh Japee.
Adani Green Energy – Adanigreen Elliott Wave technical analysis [Video]
Author

Peter Mathers
TradingLounge
Peter Mathers started actively trading in 1982. He began his career at Hoei and Shoin, a Japanese futures trading company.


