Adani Enterprises Ltd – Indian stocks Elliott Wave technical analysis [Video]
![Adani Enterprises Ltd – Indian stocks Elliott Wave technical analysis [Video]](https://editorial.fxstreet.com/images/Markets/Equities/Industries/Transportation/airplane-taking-off-637435358049026386_XtraLarge.jpg)
ADANIENT Elliott Wave technical analysis
Function: Counter Trend (Minor degree, Grey).
Mode: Corrective.
Structure: Flat (3-3-5).
Position: Minute Wave ((iii)) Navy.
Details: Minute Waves ((i)) and ((ii)) Navy of Wave C Grey are in place and Wave ((iii)) is underway now. Ideally, prices should stay below 3200.
Invalidation point: 3750.
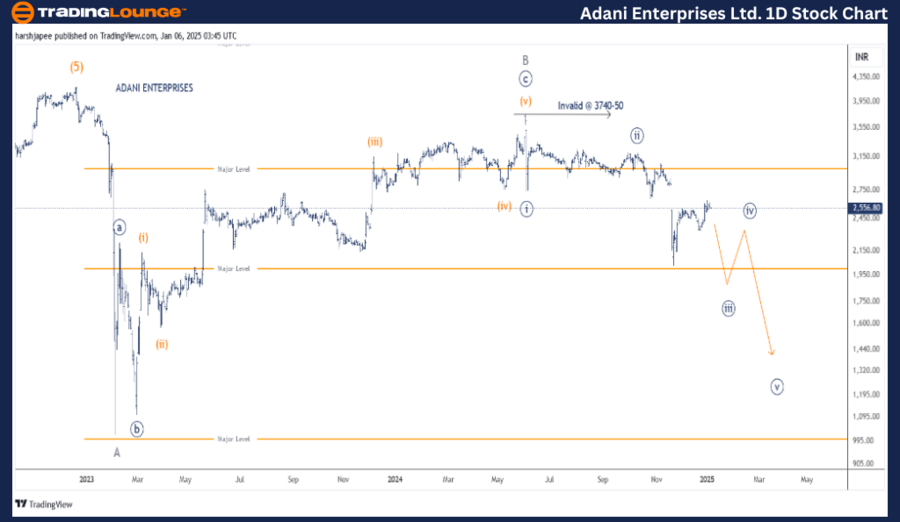
Adani Enterprises daily chart technical analysis and potential Elliott Wave counts
ADANI ENTERPRISES daily chart indicates a potential trend reversal after hitting 4170-80 range in December 2022. The stock might have terminated Intermediate Wave (5) Orange as marked and is now progressing to carve a Minor degree corrective wave A-B-C.
The stock has terminated Minor Wave A around 1020 mark in February 2023, which was followed by a corrective rally Minute ((a))-((b))-((c)) to terminate Minor Wave B Grey, around the 3740-50 range. Since then, bears have remained in control as they unfold Minor Wave C lower.
ADANIENT Elliott Wave technical analysis
Function: Counter Trend (Minor degree, Grey).
Mode: Corrective.
Structure: Flat (3-3-5).
Position: Minute Wave ((iii)) Navy.
Details: Minute Waves ((i)) and ((ii)) Navy of Wave C Grey are in place and Wave ((iii)) is underway now. It is quite possible that Minute wave ((iii)) is extending. Ideally, prices should stay below 3200.
Invalidation point: 3750.
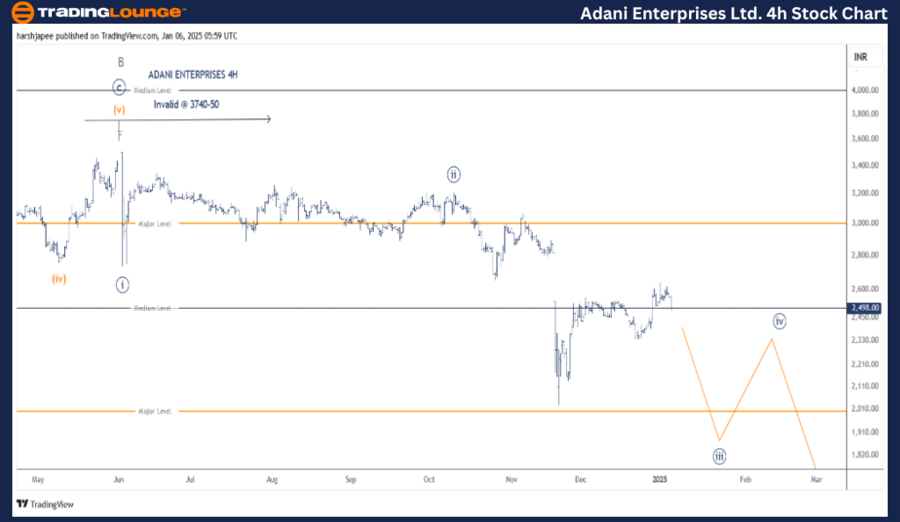
Aadani Enterprises four-hour chart technical analysis and potential Elliott Wave counts
ADANI ENTERPRISES 4H chart is highlighting the sub waves after Minor Wave B terminated around 3740-50 range. As it is normal for Wave C to unfold as an impulse, we have marked Minute Waves ((i)) and ((ii)) potentially complete around 2754 and 3214 levels respectively.
Further, Minute Wave ((iii)) could be unfolding now as a potential extension towards 1650 levels going forward. For the above to hold, prices should stay below the 3200 mark.
Conclusion
ADANI ENTERPRISES is progressing lower within Minute Wave ((iii)) of Minor Wave C towards 1650 mark.
Adani Enterprises Ltd – Indian stocks Elliott Wave technical analysis [Video]
Author

Peter Mathers
TradingLounge
Peter Mathers started actively trading in 1982. He began his career at Hoei and Shoin, a Japanese futures trading company.


