A road map to over 28000 for the NASDAQ100
Since the Elliott Wave (EW) Principle follows mass sentiment, it works better on longer time frames because the closer you look, the less collective sentiment supports each chart. For example, very few people are actively engaged on a minute-by-minute basis in the stock markets, while many check in at least once a month. Therefore, in this update for the NASDAQ100 (NDX), we’ll step back and examine the price movement since the notorious March 2020 COVID-19 low. See Figure 1 below.
Figure 1. Our preferred long-term Elliott Wave count for the NDX
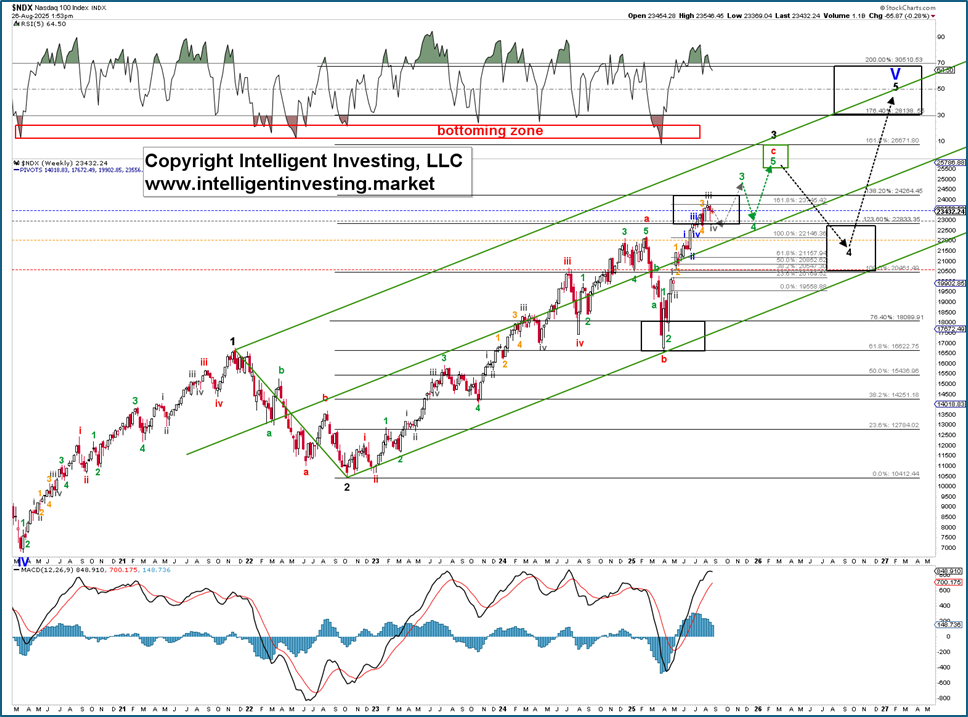
We see the index in a prolonged bull run, labeled as Primary-V in blue, which began at the notorious COVID-19 low in March 2020, labeled as the blue Primary IV. Bull runs move in five waves, and there haven't been five upward waves since that low. Allow me to explain below.
Specifically, the black Wave-1 lasted from March 2020 to November 2021, and the black W-2 ended in October 2022. Both were therefore year-long events. Additionally, the recent February-April “Trump Tariff Tantrum” crash ended at the 61.8% extension (16542 vs. 16622) and coincided with the black W-1 high (16764). Therefore, in a typical impulse, that crash could not have been a 4th wave, because waves 1 and 4 do not overlap. Furthermore, the “TTT” lasted only 7 to 8 weeks. Since it contained three (green) waves, and B-waves always consist of three waves, it should be labeled accordingly.
Thus, we consider the NDX to be in the 3rd wave of an ending diagonal (ED). The three larger advancing waves (1, 3, 5) within an ED can consist of three smaller waves. In this case, the black W-3 is subdividing into three smaller red waves: a-b-c. Therefore, the high on February 19 was W-a of W-3, the low on April 8 was W-b of W-3, and now the red W-c is underway. C-waves most often consist of five waves, which are shown in more detail in Figure 2 below.
Figure 2. The NDX weekly chart with our preferred EW count
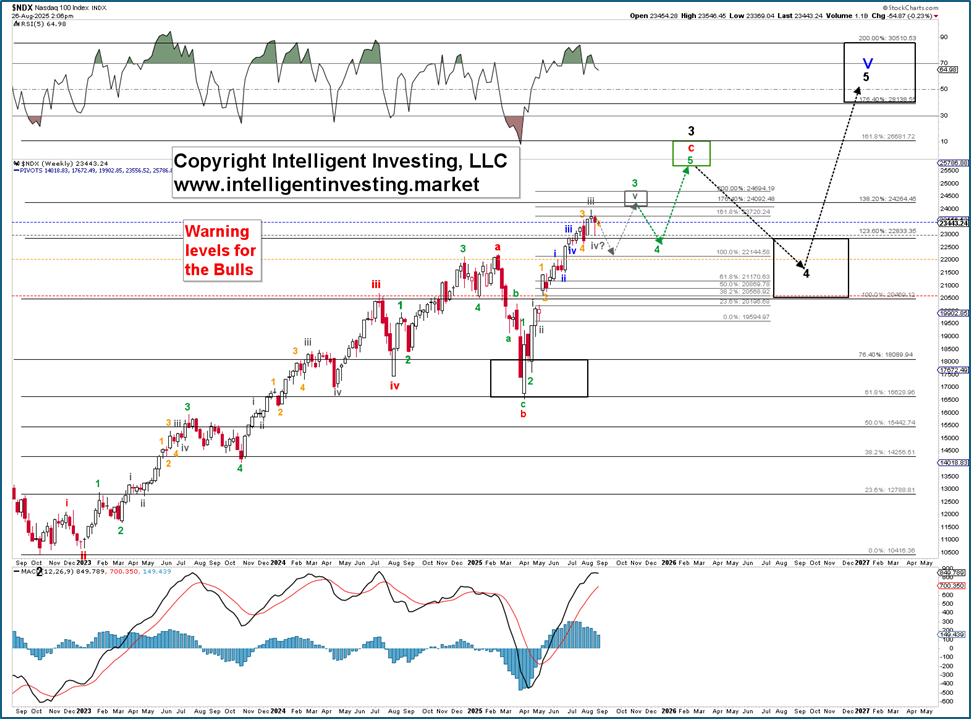
The rally from that low has so far followed an impulse-like pattern, with the NDX possibly already in the gray W-v of the green W-3, and so on. The third, fourth, and fifth waves in a typical impulse—but not necessarily in an ED—usually reach the 161.8%, 100.0%, and 200.0% extensions, respectively, at all wave degrees, barring any unforeseen but possible extensions.
In this case, the gray W-iii slightly exceeded its ideal target (23969 vs. 23720), and W-iv may have bottomed last week, falling short of its ideal target (22959 vs. 22144). Therefore, we don’t yet know if W-iv has bottomed out, which can happen occasionally since nobody has all the answers all the time. A move above the gray W-iii high will confirm this, whereas a move below last week’s low indicates the low 22000s are first before we see the gray W-v to ideally 24092-24694.
Note that this target zone is around the (black) 138.2% extension (22264) and may indicate the top of the more significant black W-3, as the target range for a third wave in an ED usually falls between the 123.6% and 138.2% extensions measured from the black W-2 low (October 2022): 22768-24178. However, as mentioned, C-waves typically consist of five waves, so we prefer to see another green W-4, W-5 sequence before the black W-4 begins. This could target the black 161.8% extension at 26680.
Since the black W-2 lasted nearly a year, we should expect the same duration for W-4. Ultimately, we anticipate the NDX to surpass 28000 within the next few years before this rally ends. However, since nothing is guaranteed, we need to set appropriate warning levels to indicate when the NDX starts to diverge from this roadmap. These levels serve as our safety nets if we’re wrong, as drops below these levels increase the chance (25%, 50%, 75%, 100%, respectively) that the top is in: 1st, blue: 23484; 2nd, gray: 22973; 3rd, orange: 22041; 4th, red: 20613. As the index rises, so will the warning levels, helping our premium newsletter members stay in the markets as long and as safely as possible, while also allowing them to exit before conditions worsen.
Author

Dr. Arnout Ter Schure
Intelligent Investing, LLC
After having worked for over ten years within the field of energy and the environment, Dr.


