- Zilliqa to Ethereum bridge was reportedly delayed until the ETH London hard fork goes live.
- ZIL price retraces to the range low at $0.0690, anticipating a 24% bounce to $0.0858.
- A breakdown of $0.0598 will invalidate the bullish outlook.
Zilliqa price is currently approaching a crucial support level that could trigger a bounce, leading to a new uptrend. However, there are chances of this barrier failing under increased selling pressure. Therefore, investors need to keep a close eye on the bounce.
ZIL-ETH bridge faces setback
The Zilliqa-ETH bridge is a highly anticipated connection that brings interoperability between the two networks. This development will benefit users and allow developers to efficiently transfer data and leverage the advantages of DeFi and offer a plethora of opportunities in areas like gaming, supply chain logistics, etc.
While the launch was estimated to occur in the third quarter of 2021, a definitive date has not yet been announced.
In a recent tweet, Amrith Kummer, the president of Zilliqa, announced that the bridge will be delayed and will not go live before the London hard fork, which is scheduled around August 4.
Other major developments related to the Zilliqa ecosystem includes the recently revealed game Zilliqa Royale, a Zilliqa blockchain-based game built on Minecraft.
Zilliqa price looks to reverse its trend
Zilliqa price rallied 67% over the past six days, slicing through the range low at $0.0690. After setting up a swing high at $0.0848, ZIL entered a corrective phase, retracing roughly 17% to where it currently stands, $0.0709.
Investors can expect this pullback to find support around the range low at $0.0690. However, if the selling pressure continues to build up, it is likely that this barrier will be breached, leading to a 12% downswing to a critical support level at $0.0598.
Market participants can expect a bullish reaction as ZIL approaches this barrier. If the buyers come to the rescue, Zilliqa price will likely rally 17% to slice through $0.0690 and, in some cases, tag the lower limit of the supply zone extending from $0.0859 to $0.0956.
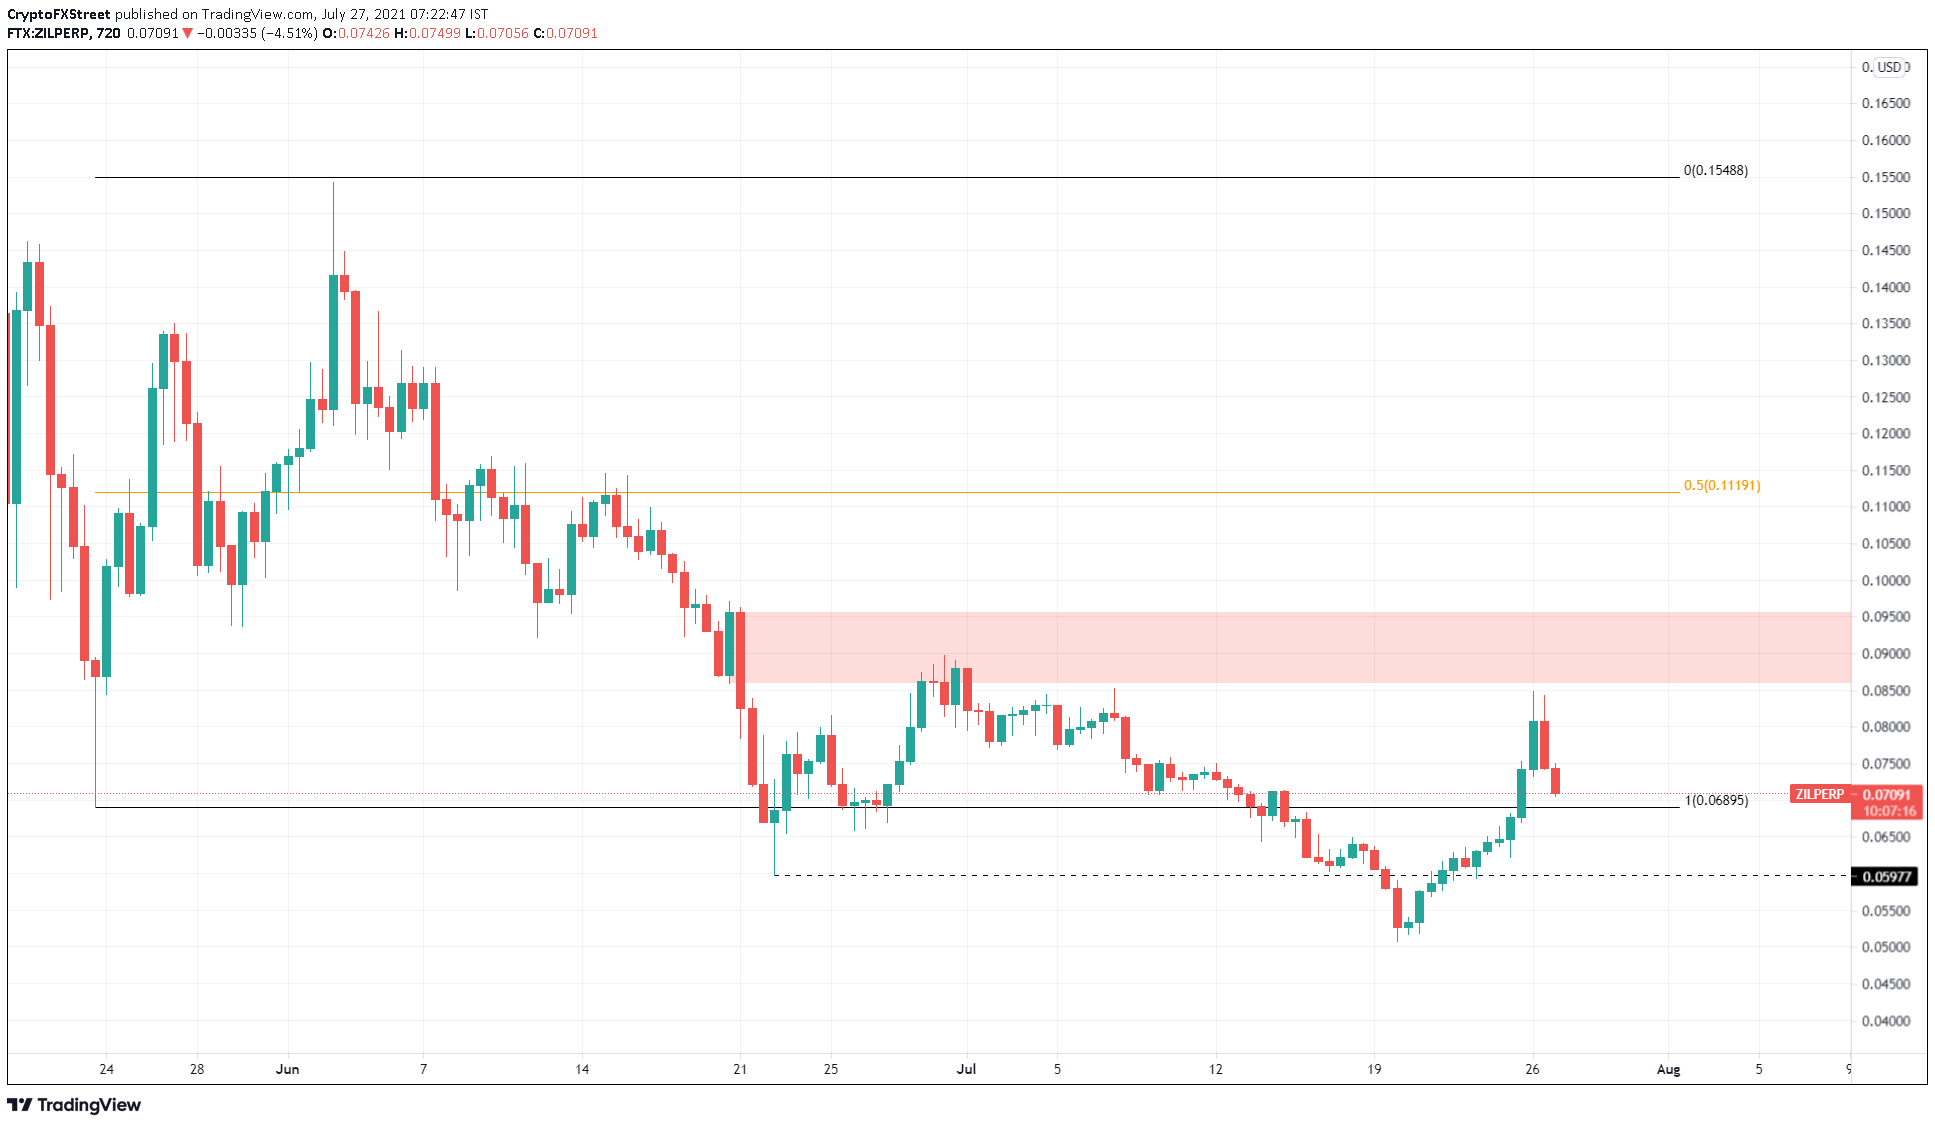
ZIL/USDT 12-hour chart
On the other hand, if the support level at $0.060 is breached, it will invalidate the bullish thesis and potentially trigger a 15% downswing to the July 20 swing low at $0.0508.
Information on these pages contains forward-looking statements that involve risks and uncertainties. Markets and instruments profiled on this page are for informational purposes only and should not in any way come across as a recommendation to buy or sell in these assets. You should do your own thorough research before making any investment decisions. FXStreet does not in any way guarantee that this information is free from mistakes, errors, or material misstatements. It also does not guarantee that this information is of a timely nature. Investing in Open Markets involves a great deal of risk, including the loss of all or a portion of your investment, as well as emotional distress. All risks, losses and costs associated with investing, including total loss of principal, are your responsibility. The views and opinions expressed in this article are those of the authors and do not necessarily reflect the official policy or position of FXStreet nor its advertisers. The author will not be held responsible for information that is found at the end of links posted on this page.
If not otherwise explicitly mentioned in the body of the article, at the time of writing, the author has no position in any stock mentioned in this article and no business relationship with any company mentioned. The author has not received compensation for writing this article, other than from FXStreet.
FXStreet and the author do not provide personalized recommendations. The author makes no representations as to the accuracy, completeness, or suitability of this information. FXStreet and the author will not be liable for any errors, omissions or any losses, injuries or damages arising from this information and its display or use. Errors and omissions excepted.
The author and FXStreet are not registered investment advisors and nothing in this article is intended to be investment advice.
Recommended Content
Editors’ Picks
Ripple's move above this key level could trigger nearly 50% rally for XRP
Ripple has overcome a critical resistance level and flipped into a support floor on the weekly time frame. This development happened while XRP tightly consolidated for roughly 250 days. Investors can expect XRP to kickstart a massive rally.
Optimism price outlook with nearly $90 million worth of OP tokens flooding markets on Friday
Optimism volatility has shrunk in the ours leading to the network’s cliff unlock. It joins the likes of dYdX and Sui, which have similar events on their calendars. As token unlocks are often considered bearish catalysts, investors should brace for a reaction after the event.
Top 3 Price Prediction Bitcoin, Ethereum, Ripple: Retail watches from the sidelines with a bias for shorts
Bitcoin could clear $73,777 peak as BTC bulls resurface. Ethereum might fall 10% before next leg up as ETH RSI teases with sell signal. XRP could lose $0.6000 threshold as Ripple bulls fail to show up.
Jito price could hit $6 as JTO coils up inside this bullish pattern
Jito price action shows a potential cup and handle formation. Based on theoretical measurement rules, a successful breakout could yield a 56% rally to $6.0. A breakdown of the $3.86 support level would create a lower low for JTO and invalidate the bullish thesis.
Bitcoin: BTC may have recovered, but is it out of the woods?
Bitcoin’s (BTC) upward momentum has shown a significant decline for the past two weeks or so. This development led to a bearish signal on the weekly and an uncertain outlook on the monthly.