Zilliqa price struggles as ZIL death cross intimidates bullish intentions
- Zilliqa price response to the June 21 decline of -24.35% has been corrective, not impulsive.
- Death Cross technical pattern will occur in the next few days, raising the stakes.
- The rising wedge measured move target for ZIL was nearly matched on June 22.

Zilliqa price printed a new correction low on June 22, following the path of many altcoins this week. The rebound has been reluctant, suggesting further weakness and potentially a test of the June 22 low. Actually, until ZIL recovers $0.085 on a daily closing basis, market operators should step back and let the cryptocurrency bring a more precise definition of the price structure.
Zilliqa price lacks conviction, and fat wallets
At the June 22 low, Zilliqa price had fallen over -75% from the May high of $0.262 and a shocking 60% from the rebound high of $0.157 on June 3, putting ZIL on par with some of the worst-performing cryptocurrencies in June.
From May 23 to June 4, Zilliqa price outlined a rising wedge pattern that finally broke to the downside on June 5. The rising wedge’s measured move is 56%, putting the target at $0.052. However, based on the extensive work of Bulkowski, the measured move is 44.50% or a target of $0.067. The ZIL low on June 22 was $0.059, fulfilling one of the targets but leaving a marginal amount of downside to reach the 56% target.
Zilliqa price requires a close above the 23.6% Fibonacci retracement of the advance beginning in March 2020 at $0.085 before considering allocating capital to ZIL. Clear of the retracement level, the altcoin could manufacture a rally to the 2020 rising trend line now at $0.116, or potentially the 200-day simple moving average (SMA) at $0.124, yielding a 45% return.
Must note that the eventual Death Cross, when the 50-day SMA crosses below the 200-day SMA, will constrain Zilliqa price in the pursuit of a superior return, and the downward pressure that accompanies the technical pattern may undermine any ZIL strength before the 23.6% retracement level.
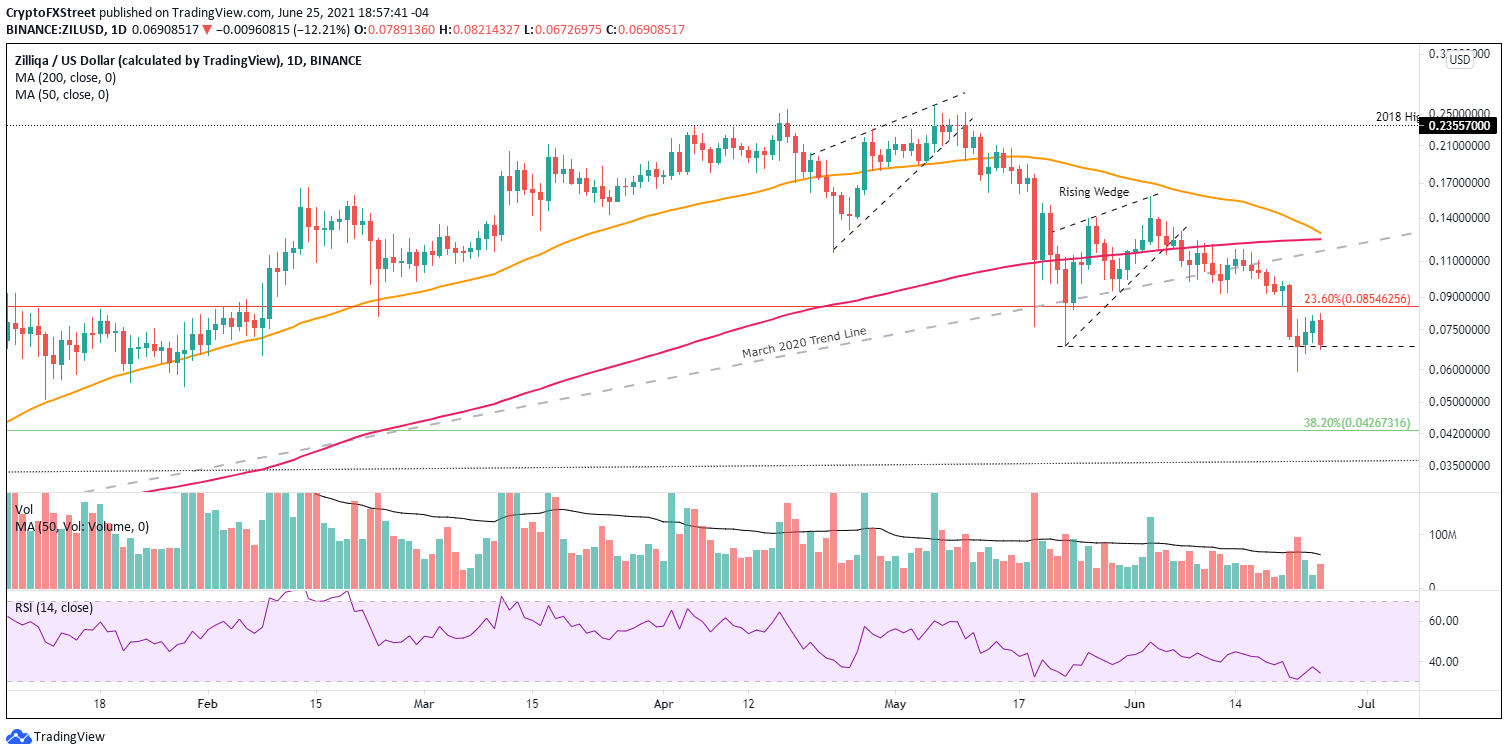
ZIL/USD daily chart
The recovery of Zilliqa price over the last two days has not been carried by the impulsiveness necessary to confirm a genuine low or installed ZIL in a constructive positive to overcome the resistance at $0.085.
The price action speaks of indecision or a dead-cat bounce. It raises the probability of more selling after today’s 10% drop, possibly pushing Zilliqa price to the original measured move target of $0.052 and a 25% loss from the current price.
A decline of that magnitude will surely put the daily Relative Strength Index (RSI) in oversold territory, thereby proving that the final ZIL low is durable.
Zilliqa price struggles reflect the broader weakness among cryptocurrencies and will be resolved to some extent by a stabilization of the market’s insecurity. Nevertheless, the purpose of the support and resistance levels reviewed in the preceding paragraphs are intended to make ZIL trading decisions more mechanical and not just emotionally driven, especially important with the Death Cross looming.
Author

Sheldon McIntyre, CMT
Independent Analyst
Sheldon has 24 years of investment experience holding various positions in companies based in the United States and Chile. His core competencies include BRIC and G-10 equity markets, swing and position trading and technical analysis.


