|

Zcash forms the wedge pattern

Zcash (ZECUSD) is trading bearish for the last year, but looking at the wave structure from Elliott wave perspective, we can see it forming and potentially finishing an ending diagonal a.k.a. wedge pattern within wave (C) of an (A)-(B)-(C) correction from the highs.

Looking at the ZECUSD daily chart, we can see a leading diagonal in wave (A), then a complex W-X-Y correction in wave (B), followed by final sell-off within the wedge formation within wave (C). Well, technically speaking, ZECUSD is trading at strong support zone, but at this stage it's important to wait for confirmations. So, only if we see sharp rebound or impulsive recovery back above 83 first bullish evidence level, only then we can confirm support in place and bulls back in the game.

zecusdD

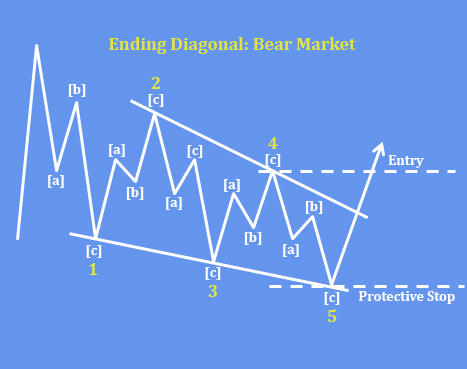
The ending diagonal (wedge) pattern is a special type of wave that occurs in wave 5 of an impulse. An ending diagonal pattern is a type of pattern that can occur at the completion of a strong move. It reflects a “calming” of the market sentiment such that price still moves generally in the direction of the larger move, but not strongly enough to produce an impulsive wave. Ending diagonals consist of five waves, labeled 1-2-3-4-5, where each wave subdivides into three legs. Waves 1 and 4 overlap in price, while wave 3 can not be the shortest amongst waves 1, 3 and 5.

fxsoriginal

LIMITE TIME OFFER for wavetraders services: Get 2 Months For Price of 1.


Get Full Access To Our Premium Elliott Wave Analysis For 14 Days. Click here.

Author

Gregor Horvat

Gregor Horvat

Wavetraders

Experience Grega is based in Slovenia and has been in the Forex market since 2003.

More from Gregor Horvat
Share:

Editor's Picks

Bitcoin, Ethereum and Ripple consolidate after massive sell-off

Bitcoin, Ethereum, and Ripple prices consolidated on Monday after correcting by nearly 9%, 8%, and 10% in the previous week, respectively. BTC is hovering around $70,000, while ETH and XRP are facing rejection at key levels. Traders should be cautious: despite recent stabilization, upside recovery for these top three cryptocurrencies is capped as the broader trend remains bearish.

Ethereum: Trend Research capitulates, BitMine's Thomas Lee sees a V-shaped recovery

Ethereum had one of its sharpest historic declines over the past 10 days, shedding 40% of its value and briefly sliding below $2,000. The dip also saw ETH move below its realized price, or the average cost basis of investors — an occurrence that has historically accelerated selling pressure as investors cut losses.

Why Bitcoin and top cryptos are falling: Bitwise

The crypto market crash since October isn't down to a single factor but a combination of several, according to Bitwise CIO Matt Hougan. In a note to investors on Friday, Hougan outlined six key factors that potentially contributed to the crash that pushed down nearly every top crypto by more than 50% from prices seen over four months ago.

XRP recovery gains momentum despite retail market decline

Ripple is accelerating its recovery, trading above $1.36 at the time of writing on Friday, as investors adjust their positions following a turbulent week in the broader crypto market. The remittance token is up over 21% from its intraday low of $1.12.

Bitcoin Price Annual Forecast: BTC holds long-term bullish structure heading into 2026

Bitcoin (BTC) is wrapping up 2025 as one of its most eventful years, defined by unprecedented institutional participation, major regulatory developments, and extreme price volatility.

Bitcoin: The worst may be behind us

Bitcoin (BTC) price recovers slightly, trading at $65,000 at the time of writing on Friday, after reaching a low of $60,000 during the early Asian trading session. The Crypto King remained under pressure so far this week, posting three consecutive weeks of losses exceeding 30%.