Yearn.Finance price gears up for a 25% move towards $31,000
- Yearn.Finance price is contained inside a descending wedge on the daily chart.
- The digital asset faces very little resistance to the upside.

Yearn.Finance has been trading inside a descending wedge pattern since November 2020, slowly losing strength but gearing up for a potentially massive breakout. On-chain metrics suggest the odds of a breakout are high.
Yearn.Finance price has slowed down but on-chain metrics are favorable
On the daily chart, YFI has established a long-term descending wedge pattern and it’s close to a breakout above the resistance level at $24,700. Cracking this resistance point can quickly push YFI price towards $31,000.

YFI/USD daily chart
It seems that the number of whales holding between 100 and 1,000 YFI coins ($2,400,000 and $24,000,000) has increased significantly since November 2020, jumping from 27 to a current high of 41.
%20[21.31.55,%2006%20Jan,%202021]-637455620505797705.png)
YFI Holders Distribution chart
Additionally, the In/Out of the Money Around Price (IOMAP) chart shows very little resistance to the upside above $25,000 well until $29,000, but strong support in comparison from $24,700 until $22,618.
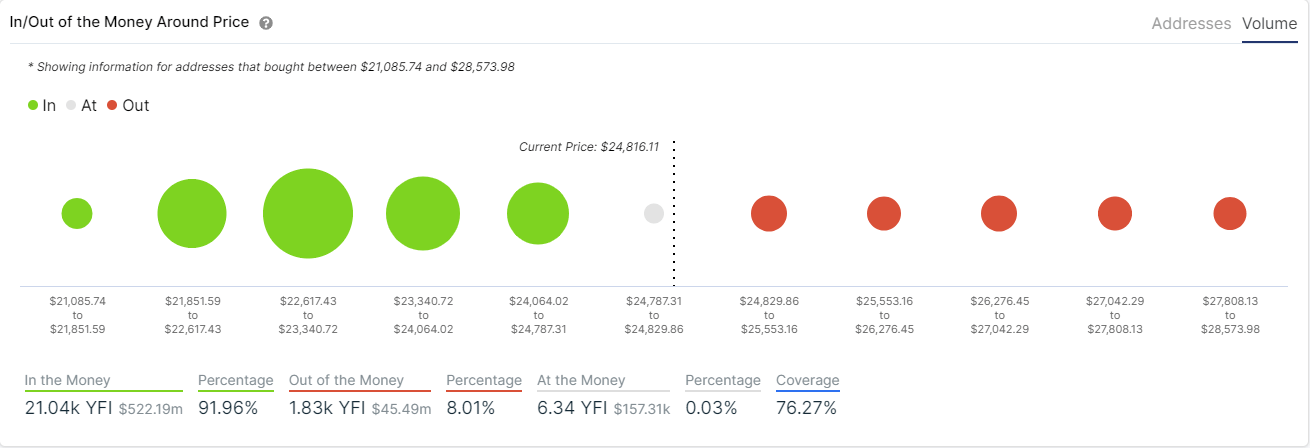
YFI IOMAP chart
However, despite all the good metrics, YFI is still facing a tough resistance level at $24,700. Rejection from this point can push Yearn.Finance price down to the most significant support area between $22,617 and $23,340 according to the IOMAP chart.
Author

Lorenzo Stroe
Independent Analyst
Lorenzo is an experienced Technical Analyst and Content Writer who has been working in the cryptocurrency industry since 2012. He also has a passion for trading.


