|

XRP/USD technical analysis: We are about to see if XRP has run out of momentum

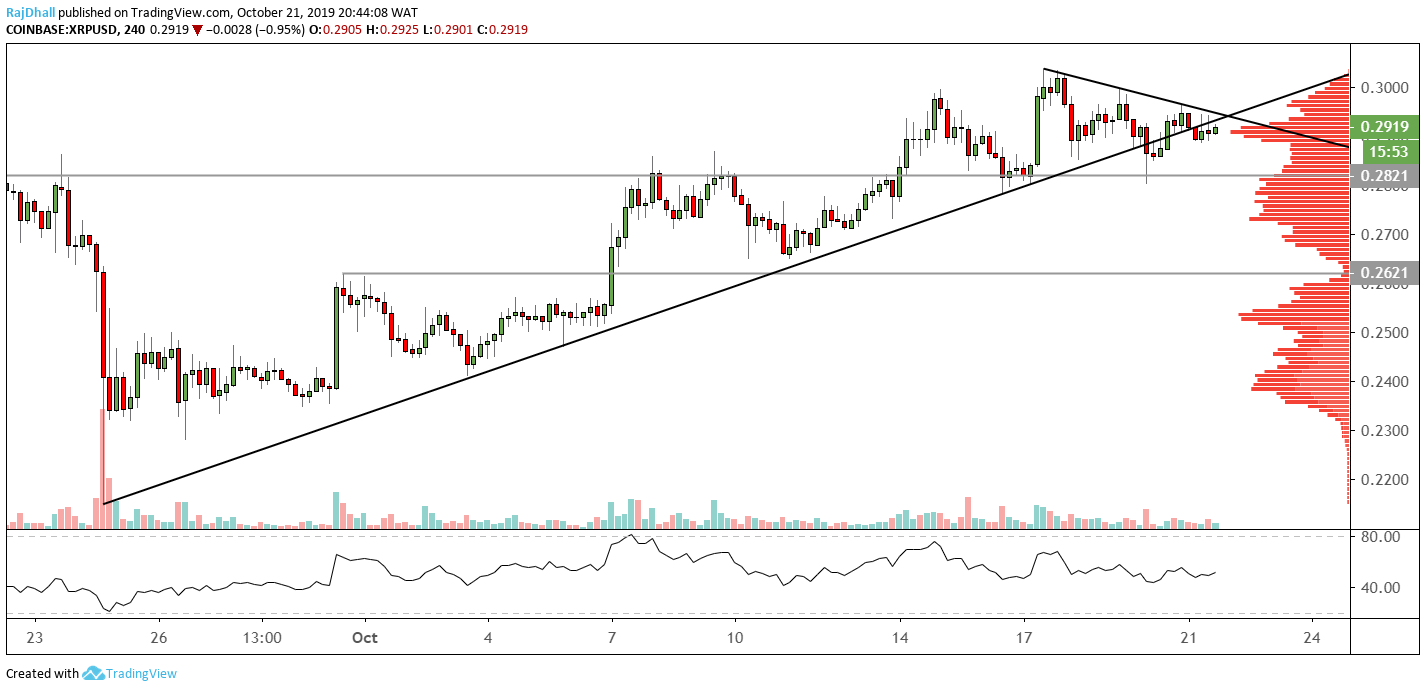
  • XRP/USD has broken the trendline to the downside but the price is still in a technical uptrend.
  • The 0.2821 support level is a strong one and has held firm in the past.

XRP/USD has been one of the darlings of the crypto market over the last few weeks rising 9.42% since 24th September.

The 0.3000 resistance level is proving to be a tough nut to crack for the bulls and if the XRP/USD is to push higher it needs to break the psychological level,

The relative strength index (RSI) is showing signs of a momentum drop off as the price made high highs the indicator made lower highs. 

At the moment, on the four-hour chart, the candlesticks are showing signs of indecision as they are forming Doji candles. 

Also, the trendline broke lower on 20th October. This proved to be a false break as the XRP/USD price moved back above the trendline.

Subsequently, the price broke back below and is now retesting the trendline which could indicate there might be a move lower on the cards.

For now, the main resistance is 0.3038 and the key support lies at 0.2821.

Ripple Analysis

XRP/USD

Overview
Today last price0.292
Today Daily Change-0.0027
Today Daily Change %-0.92
Today daily open0.2947
 
Trends
Daily SMA200.2726
Daily SMA500.2666
Daily SMA100 0.2825
Daily SMA2000.3289
 
Levels
Previous Daily High0.2972
Previous Daily Low0.2819
Previous Weekly High 0.3041
Previous Weekly Low0.2718
Previous Monthly High0.327
Previous Monthly Low0.2168
Daily Fibonacci 38.2%0.2914
Daily Fibonacci 61.8%0.2878
Daily Pivot Point S10.2854
Daily Pivot Point S20.276
Daily Pivot Point S30.2701
Daily Pivot Point R10.3006
Daily Pivot Point R20.3065
Daily Pivot Point R30.3159

Author

Rajan Dhall, MSTA

Rajan Dhall is an experienced market analyst, who has been trading professionally since 2007 managing various funds producing exceptional returns.

More from Rajan Dhall, MSTA
Share:

Editor's Picks

Crypto Today: Bitcoin at $60,000, Ethereum at $1,500, and XRP at $1 face a make-or-break test

Bitcoin (BTC), Ethereum (ETH), and Ripple (XRP) are trading in the red on Friday after three consecutive days of losses, testing their respective make-or-break support levels.

Bitcoin Weekly Forecast: BTC hits 20-month low, will the pain continue?

Bitcoin recovers slightly, trading at $66,000 on Friday after reaching a new yearly low of $58,115 earlier this week, its lowest level since October 2024. Institutional selling intensified as spot ETFs recorded $1.35 billion in net outflows through Thursday.

XRP clings to $1 as long liquidations deepen bearish trend

Ripple trades near the key psychological support level of $1 at the time of writing on Friday after losing more than 8% so far this week. CoinGlass liquidation data shows that over 97% XRP long positions were wiped out over the past 24 hours.

Pi Network Price Forecast: Minor recovery amid market crash fuels short-term hope

Pi Network price records a mild 3% recovery at press time on Friday, shaping a rebound from a broken descending trendline. The declining trend in trading volume has stabilized around $10 million this week, supporting the possibility of an extended recovery as selling pressure wanes.

Bitcoin: Recovery hopes fade after the Fed spoils the party
Bitcoin (BTC) is set to end the week in the red, trading near the 200-Week Simple Moving Average (SMA) at around $62,300 on Friday. Institutional selling persists, capping BTC’s recovery as spot Exchange Traded Funds (ETFs) point to a sixth consecutive week of outflows.