|

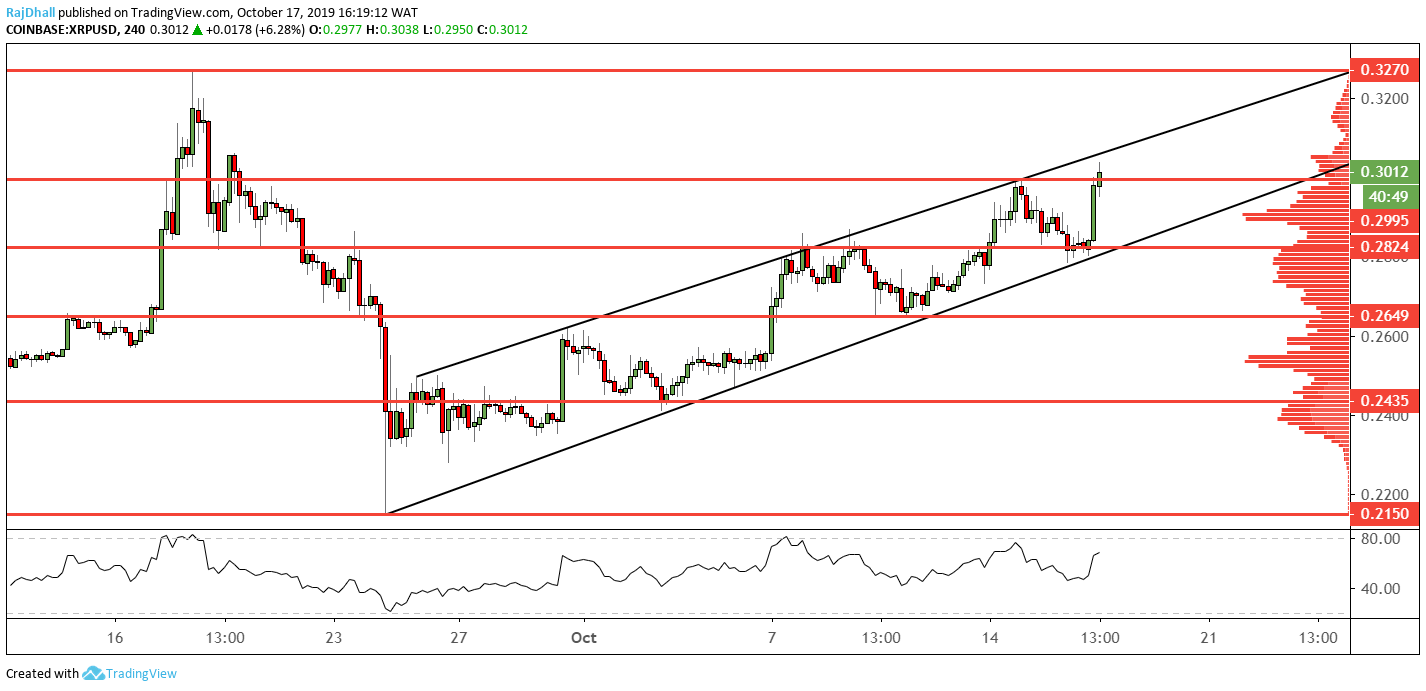
XRP/USD technical analysis: Ripple breaks the 0.3000 psychological mark

  • Ripple is trading 6.28% higher and has just broken the 0.3000 level.
  • The XRP/USD price is still in a channel formation and looks set to test the top.

XRP/USD is one of the outperformers in the cryptocurrency markets, trading 6.28% higher on the session.

The price structure interestingly stayed in an uptrend while lots of the crypto majors fell to lows in Wednesday's session.

We see why, as the trend of higher lows and higher highs continues. There was a really strong thrust higher which momentarily stopped at 0.3000 and subsequently price broke through on the next four-hour candle on the chart below.

The price is above the peak of the bell curve on the volume profile indicator and could continue to the next resistance at 0.3270, which is the wave high from September 18th. 

On the daily chart, we are still in a downtrend and only if the wave high of 0.3270 is broken we can consider it a technical break in trend. 

Also of note, on the relative strength index (RSI) indicator, the waves may make a lower high despite price making a higher high this is often an indication of bullish momentum running out of steam. We will have to wait and see if that is the case.

Ripple Analysis

XRP/USD

Overview
Today last price0.3013
Today Daily Change0.0174
Today Daily Change %6.13
Today daily open0.2839
 
Trends
Daily SMA200.2619
Daily SMA500.2637
Daily SMA1000.2855
Daily SMA2000.3295
 
Levels
Previous Daily High0.2923
Previous Daily Low0.2788
Previous Weekly High 0.2879
Previous Weekly Low 0.2515
Previous Monthly High0.327
Previous Monthly Low0.2168
Daily Fibonacci 38.2%0.2839
Daily Fibonacci 61.8%0.2871
Daily Pivot Point S10.2777
Daily Pivot Point S20.2715
Daily Pivot Point S30.2641
Daily Pivot Point R10.2912
Daily Pivot Point R20.2985
Daily Pivot Point R30.3048

Author

Rajan Dhall, MSTA

Rajan Dhall is an experienced market analyst, who has been trading professionally since 2007 managing various funds producing exceptional returns.

More from Rajan Dhall, MSTA
Share:

Editor's Picks

Top 3 Price Prediction: Bitcoin, Ethereum, Ripple deepen sell-off as bears take control of momentum

Bitcoin, Ethereum, and Ripple continued their corrections on Friday, posting weekly losses of nearly 6%, 3%, and 5%, respectively. BTC is nearing the November lows at $80,000, while ETH slips below $2,800 amid increasing downside pressure.

Shiba Inu Price Forecast: SHIB extends losses as whale selling intensifies bearish momentum

Shiba Inu (SHIB) price slips below $0.0000077 on Thursday after correcting the previous day. Bearish sentiment is further strengthened as holders offload SHIB, increasing selling pressure and reducing Open Interest in the derivatives market.

Top Crypto Losers: Worldcoin, Chiliz, Hyperliquid lead losses as market bleeds $1.75 billion

Worldcoin , Chiliz , and Hyperliquid posted heavy losses over the last 24 hours as Bitcoin dropped below $82,000 on Friday, triggering a $1.75 billion wipeout and mirroring the bearish tremors in the US stock market.

Fidelity unveils FIDD stablecoin, set to launch in coming weeks

Fidelity Investments announced that it will launch its first stablecoin, the Fidelity Digital Dollar (FIDD), making it one of the first large traditional firms in the US to do so.

Bitcoin Price Annual Forecast: BTC holds long-term bullish structure heading into 2026

Bitcoin (BTC) is wrapping up 2025 as one of its most eventful years, defined by unprecedented institutional participation, major regulatory developments, and extreme price volatility.

Bitcoin: BTC correction deepens as Fed stance, US-Iran risks, mining disruptions weigh

Bitcoin (BTC) price extends correction, trading below $82,000 after sliding more than 5% so far this week. The bearish price action in BTC was fueled by fading institutional demand, as evidenced by spot Exchange-Traded Funds (ETFs), which recorded $978 million in inflows through Thursday.