- XRP price is down 4% on the day as bears forged a rejection near $0.420.
- XRP price could decline toward $0.365 based on recent bearish signals.
- A breach above $0.328 would invalidate the bearish thesis.
XRP price validated last week's bullish trade by breaching $0.420. Now the same target area is acting as resistance, setting up a downswing toward the origin points of the previous rally.
XRP price could sweep the lows
XRP price is experiencing backlash since breaching last week's bullish target zone. After hovering within the $0.42 zone for two days, the bears denied entry into the 43 cents barrier, causing a 4% decline back into the $0.40 zone. The downward move, which Is now the largest red day of 2023, could be the start of a much steeper retracement.
XRP price currently auctions at $0.40. The Relative Strength Index (RSI) is an indicator used to forecast market bottoms and tops by assessing previous rallies. The RSI has a classic M shape pattern at the 70 level. The M-shaped formation, which is bearish, also printed a bearish divergence between the recent swing highs at $0.40 and $0.42. Combining these factors, there is a strong confluence that the XRP uptrend, which began on January 1, may have ended.
If the market is as genuinely bearish as it seems, then a breach of the 8-day exponential moving average at $0.39 could be the catalyst of a decline toward lower liquidity levels. Key target zones to aim for would be the 21-day simple moving average at $0.370 and the swing low at $0.365 established on June 14.
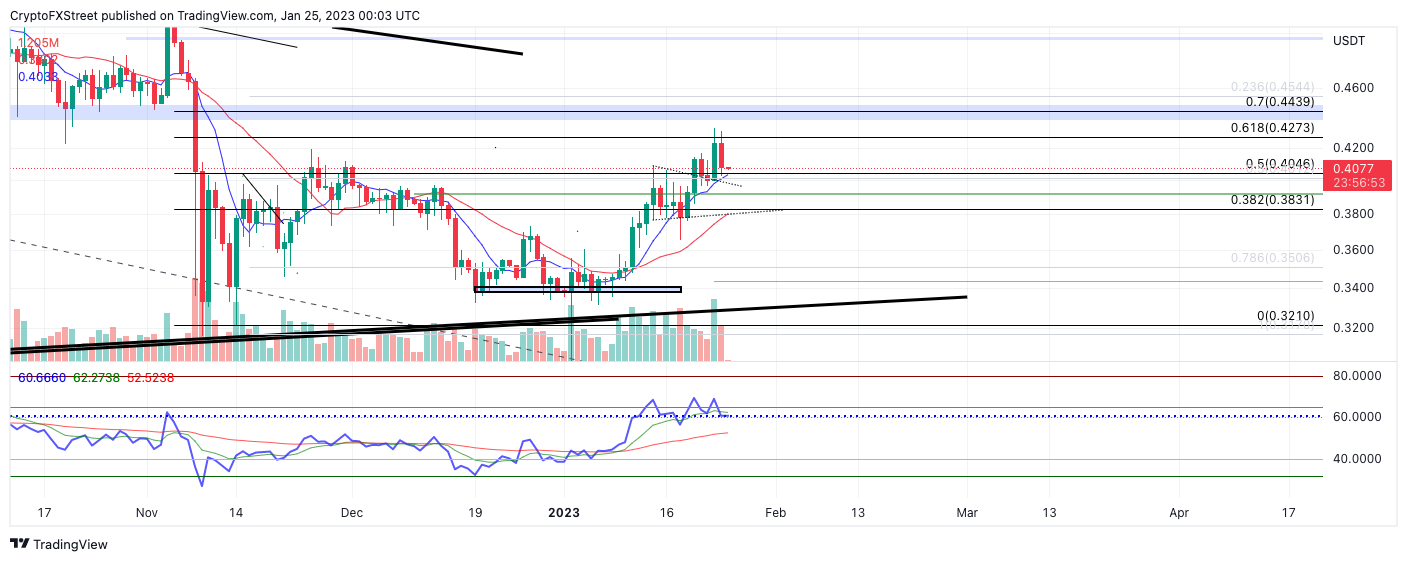
XRP/USDT 1-day chart
The bears may be able to use the recent swing highs at $0.428 as a marker to invalidate the bearish thesis. A breach of the aforementioned level would induce further upside momentum targeting the broken support zone at $0.44. The XRP price would incline by 10% if the bulls were to succeed.
Information on these pages contains forward-looking statements that involve risks and uncertainties. Markets and instruments profiled on this page are for informational purposes only and should not in any way come across as a recommendation to buy or sell in these assets. You should do your own thorough research before making any investment decisions. FXStreet does not in any way guarantee that this information is free from mistakes, errors, or material misstatements. It also does not guarantee that this information is of a timely nature. Investing in Open Markets involves a great deal of risk, including the loss of all or a portion of your investment, as well as emotional distress. All risks, losses and costs associated with investing, including total loss of principal, are your responsibility. The views and opinions expressed in this article are those of the authors and do not necessarily reflect the official policy or position of FXStreet nor its advertisers. The author will not be held responsible for information that is found at the end of links posted on this page.
If not otherwise explicitly mentioned in the body of the article, at the time of writing, the author has no position in any stock mentioned in this article and no business relationship with any company mentioned. The author has not received compensation for writing this article, other than from FXStreet.
FXStreet and the author do not provide personalized recommendations. The author makes no representations as to the accuracy, completeness, or suitability of this information. FXStreet and the author will not be liable for any errors, omissions or any losses, injuries or damages arising from this information and its display or use. Errors and omissions excepted.
The author and FXStreet are not registered investment advisors and nothing in this article is intended to be investment advice.
Recommended Content
Editors’ Picks
Ripple's move above this key level could trigger nearly 50% rally for XRP
Ripple has overcome a critical resistance level and flipped into a support floor on the weekly time frame. This development happened while XRP tightly consolidated for roughly 250 days. Investors can expect XRP to kickstart a massive rally.
Optimism price outlook with nearly $90 million worth of OP tokens flooding markets on Friday
Optimism volatility has shrunk in the ours leading to the network’s cliff unlock. It joins the likes of dYdX and Sui, which have similar events on their calendars. As token unlocks are often considered bearish catalysts, investors should brace for a reaction after the event.
Top 3 Price Prediction Bitcoin, Ethereum, Ripple: Retail watches from the sidelines with a bias for shorts
Bitcoin could clear $73,777 peak as BTC bulls resurface. Ethereum might fall 10% before next leg up as ETH RSI teases with sell signal. XRP could lose $0.6000 threshold as Ripple bulls fail to show up.
Jito price could hit $6 as JTO coils up inside this bullish pattern
Jito price action shows a potential cup and handle formation. Based on theoretical measurement rules, a successful breakout could yield a 56% rally to $6.0. A breakdown of the $3.86 support level would create a lower low for JTO and invalidate the bullish thesis.
Bitcoin: BTC may have recovered, but is it out of the woods?
Bitcoin’s (BTC) upward momentum has shown a significant decline for the past two weeks or so. This development led to a bearish signal on the weekly and an uncertain outlook on the monthly.